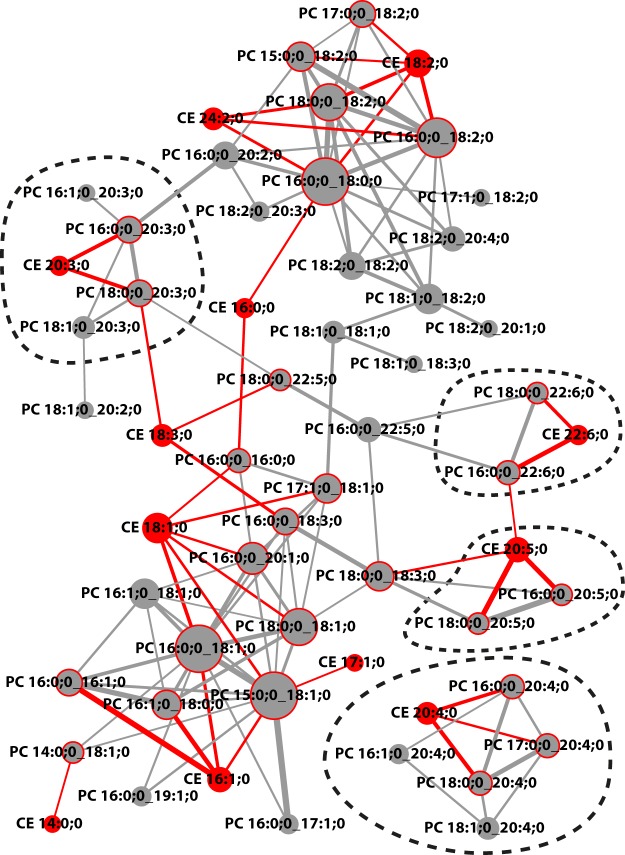
Figure 2.
Correlation network of CE and PC lipid subspecies with cutoff r = 0,7 (as indicated in Fig. 1B). Node fill colors show PCs in grey and CEs in red. Node size is adjusted to the number connections. Red node border colors in PC nodes indicate a connection to a CE. Edge color is grey for PC-PC connections and red if a CE is involved. Edge stroke widths indicate the magnitudes of the correlation coefficient. Dashed lines encircle clusters sharing the same fatty acids.

