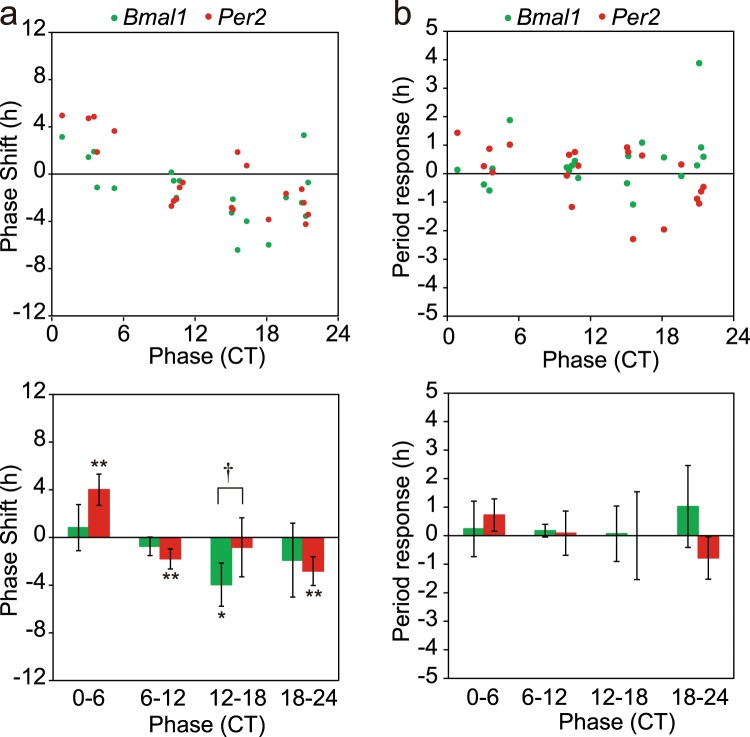
Figure 6.
Phase-response curve and period-response curve for medium exchange of circadian Bmal1 and Per2 rhythms in the adult SCN (a) Phase-responses in individual slices (n = 20) of circadian Bmal1 (green circle) and Per2 (red circle) rhythms in the adult SCN (upper). The SCN was pretreated with distilled water (see text). Mean phase-shifts with SD at CT0–CT6 (n = 5), CT6–CT12 (n = 4), CT12–CT18 (n = 5) and CT18–CT20 (n = 6) (lower). See also the legend for Fig. 4a. A significant phase-shift is indicated with asterisk (*). *p < 0.05, **p < 0.01, and a significant difference in the response between the two circadian rhythms is shown with dagger (†). †p < 0.05. (b) Period-responses obtained from the same experiment as (a). Period-responses in individual slices of circadian Bmal1 (green circle) and Per2 (red circle) (upper), and the mean responses with SD at the 4 circadian phases (lower).

