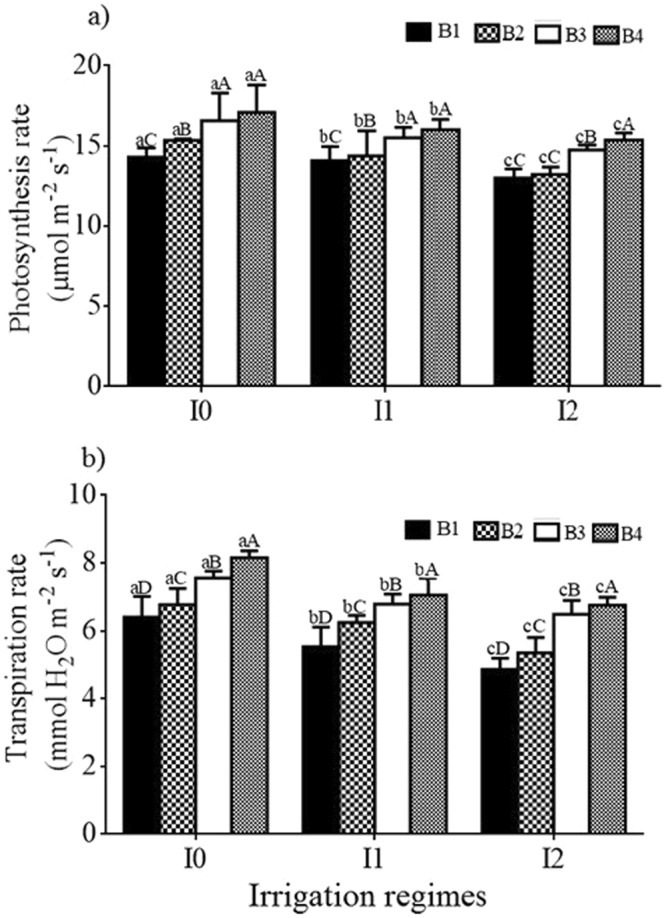
Figure 2.

Rates of (a) photosynthesis and (b) transpiration for different irrigation water salinity and biochar treatments for season 2014. Different uppercase and lowercase letters indicate a significant difference between different biochar application rates (for a given irrigation regime) and different salinity levels, respectively, at P < 0.05. B1, B2, B3 and B4 represent mixtures of soil with 0%, 2%, 4% and 8% of biochar by mass. I0, I1 and I2 represent irrigation water salinity of tap water, 1 and 3 dS m−1.
