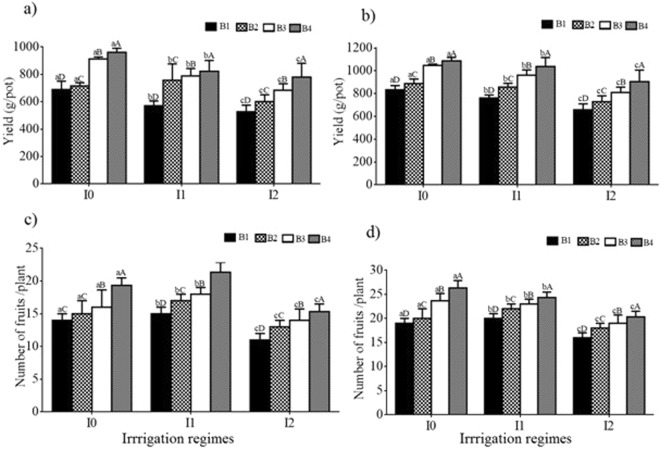
Figure 3.
Yield (a,b) and number of fruits per plant (c,d) in 2014 and 2015, respectively, for different irrigation water salinity and biochar treatments. For each year, different uppercase and lowercase letters indicate a significant difference among different biochar application rates (for a given irrigation regime) and salinity levels, respectively, at P < 0.05. B1, B2, B3 and B4 represent mixtures of soil with 0%, 2%, 4% and 8% of biochar by mass. I0, I1 and I2 represent irrigation water salinity of tap water, 1 and 3 dS m−1.

