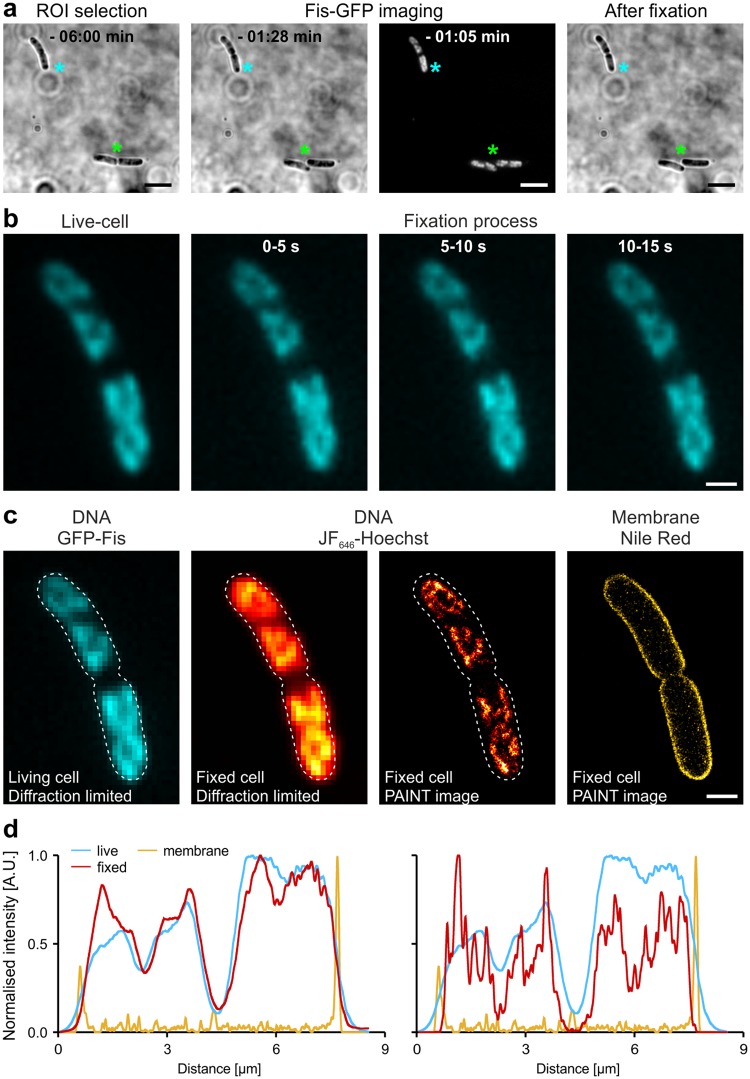
Figure 2.
Influence of formaldehyde fixation on nucleoid morphology and distribution. (a) Living MG1655 wildtype cells grown in LB medium at 32 °C and expressing GFP-Fis immobilised on a chitosan-coated surface. Cells maintained cell growth and division (green asterisk). (b) Cells were fixed on-the-slide while concomitantly recording the GFP-Fis signal (cyan hot). Time stamps indicate the time after formaldehyde addition, each image represents an average of 5 imaging frames. The bacterium shown corresponds to the bacterium marked by cyan asterisk in (a). (c) Comparison of GFP-Fis signal recorded prior to fixation with the respective PAINT image acquired using JF646-Hoechst after 30 min FA fixation. A diffraction limited image of the PAINT channel was reconstructed by calculating the standard deviation image from 5,000 imaging frames. White dashed lines indicate the outlines determined from the membrane PAINT image, which was acquired in parallel imaging mode using Nile Red (scale bars: 3 µm in a and 1 µm in b and c). (d) Normalised intensity profiles of the cell shown in (c). Profiles were determined along the bacterial long axis for the GFP-Fis signal recorded in the living cell (cyan lines, both plots), the reconstructed diffraction-limited PAINT signal of DNA (red line, left plot), the super-resolved PAINT signal of DNA from the fixed cell (red line, right plot) and the PAINT signal of the membrane (yellow lines, both plots).

