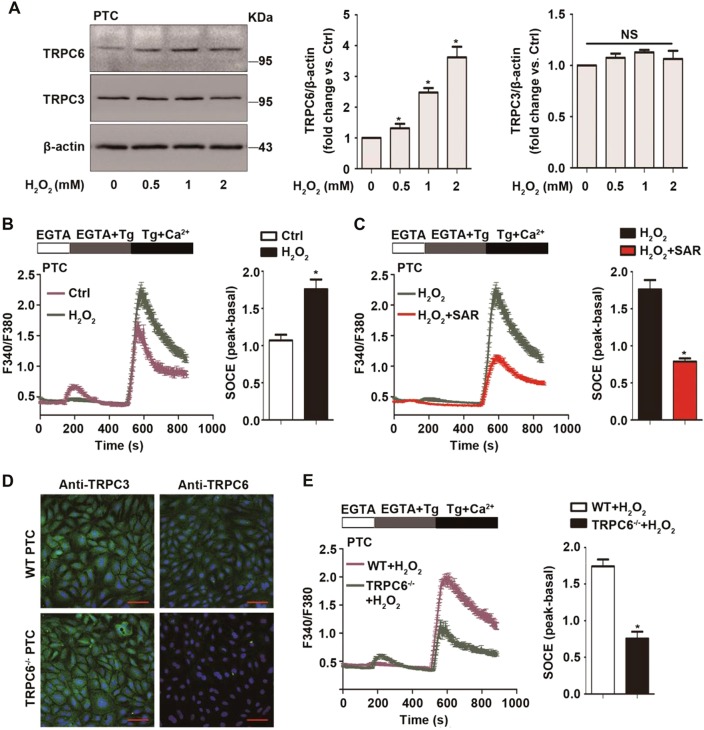
Fig. 1. Oxidative stress increases TRPC6 expression and triggers Ca2+ influx via TRPC6-mediated store-operated Ca2+ entry (SOCE).
a Representative western blot images of TRPC6 and TRPC3 in primary PTC after treatment with different concentrations of H2O2 for 12 h. Data are expressed as mean ± SEM, n = 3; NS indicates not significant, *P < 0.05. b Representative traces showing the Thapsigargin (Tg)-evoked transient increase in [Ca2+]i (SOCE) after treatment with 0.5 mM H2O2 for 30 min or left untreated. Quantification of peak SOCE values are expressed as mean ± SEM, n = 3 (40–60 cells for each independent experiment); *P < 0.05. c Representative traces showing the Tg-evoked SOCE after treatment with H2O2 in the presence and absence of TRPC6 inhibitor SAR7334 (100 nM). Quantification of peak SOCE values are expressed as mean ± SEM, n = 3 (40–60 cells per experiment); *P < 0.05. d Immunohistochemistry analysis of the TRPC6 and TRPC3 expression in PTC isolated from WT and TRPC6-/- mice, Scale Bar = 20 μm. e Representative traces showing the Tg-evoked SOCE in PTC isolated from WT and TRPC6-/- mice after treatment with H2O2. Quantification of peak SOCE values are expressed as mean ± SEM, n = 3 (40–60 cells per experiment); *P < 0.05

