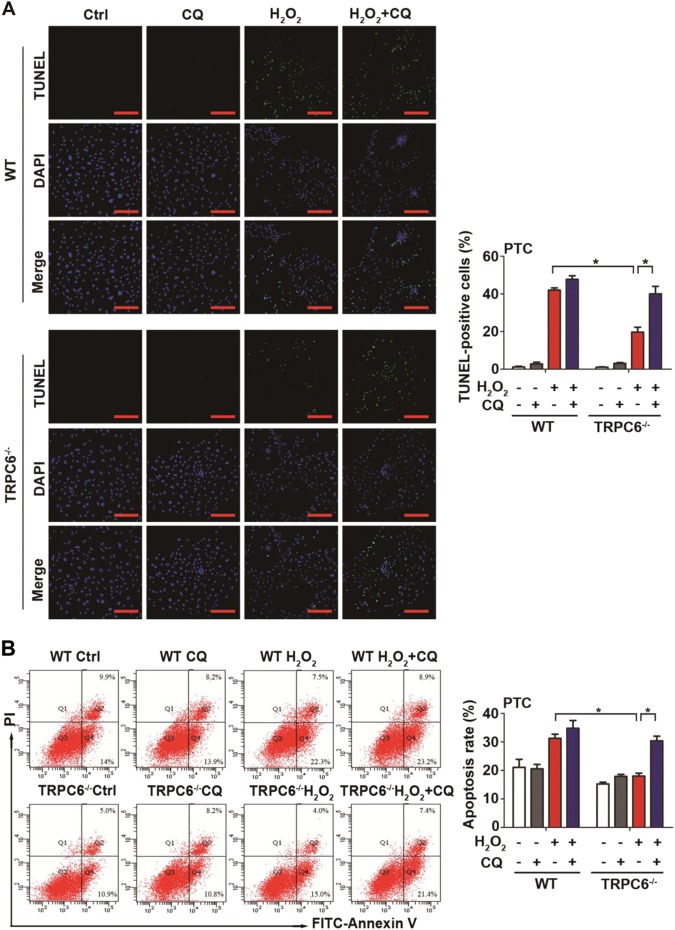
Fig. 6. Blockage of autophagy prevents the protective effect of TRPC6 knockout.
PTC isolated from WT or TRPC6-/- mice were divided into eight different groups and treated with H2O2 (0.5 mM) in the absence and presence of CQ (25 μM) for 12 h. a Representative TUNEL staining of PTC in each group, Scale Bar = 50 μm. Bar graph is showing the quantification of TUNEL-positive cells. Data are expressed as mean ± SEM, n = 6; *P < 0.05. b Representative flow cytometric assessment of apoptosis via double-staining with Annexin V-FITC and PI. Bar diagram is showing the apoptosis rates of different groups. Data are expressed as mean ± SEM, n = 3; *P < 0.05

