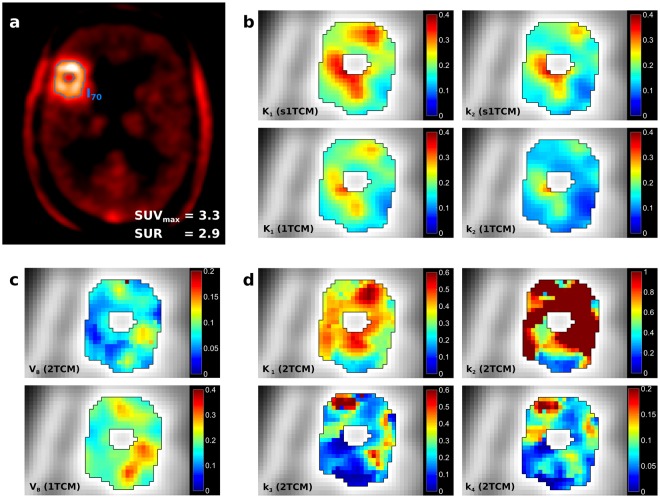
Figure 2.
Parameter maps from fits with different compartment models in an exemplary patient with grade IV glioma. Pharmacokinetic analysis was performed within an isocontour of 70%, which was delineated based on the endpoint static summation image, as illustrated in (a). SUVmax and SUR were extracted, where SUR is the ratio between SUVmax and mean background SUV. Both the standard 1TCM and a simplified 1TCM were fitted voxelwise to the time-activity curves (TACs), yielding estimates for exchange rates K1 and k2 (b). Furthermore, TACs were fitted with the more complex 2TCM, which yields metabolic exchange rates K1, k2, k3 and k4 (d). The general definitions of the 1TCM and 2TCM yield estimates on the blood volume VB, which is displayed in (c). In the simplified 1TCM (s1TCM), the blood volume is assumed to be zero VB = 0. Parameter maps of tracer kinetic analysis show enhanced detail on tumor substructure, however, stability is decreased for the 2TCM. Both 1TCM and 2TCM yield similar distributions of VB, indicating that the parameter is not negligible.

