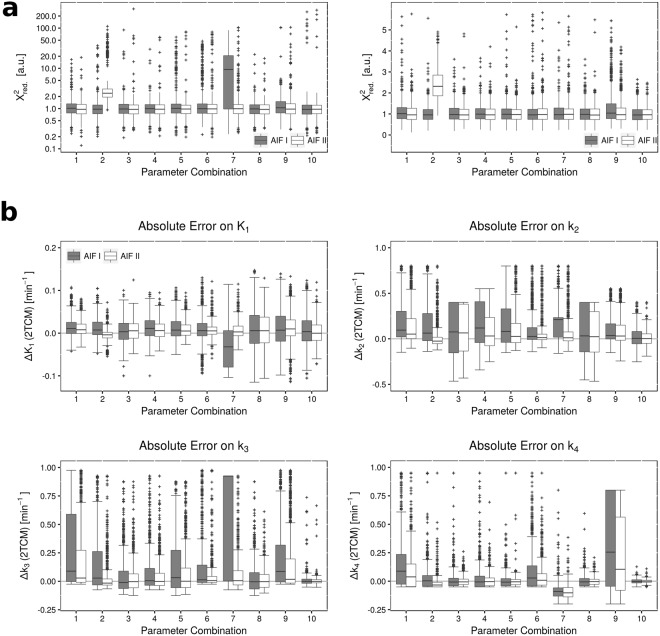
Figure 9.
Results from fitting simulated data with the 2TCM. Figure 7 (a) shows goodness-of-fits in terms of reduced X², for each of the 10 different parameter combinations (with both AIFs). Due to outliers at very high values, the y-axis in the left plot is displayed on a logarithmic scale. For more detailed evaluation, the right plot shows the distribution of X² at an enlarged linear scale. Apart from two exceptions, both AIF types yielded similar fit quality. Figure 7 (b) shows the distribution of absolute errors in each of the four model parameters K1, k2, k3 and k4. The absolute error was calculated as the parameter estimate minus the true value used for simulation. While K1 yields good accuracy and robustness, k2 showed lowest stability of all parameters. k3 and k4 showed tendencies towards positive values for the errors, indicating a systematic overestimation of these two parameters.

