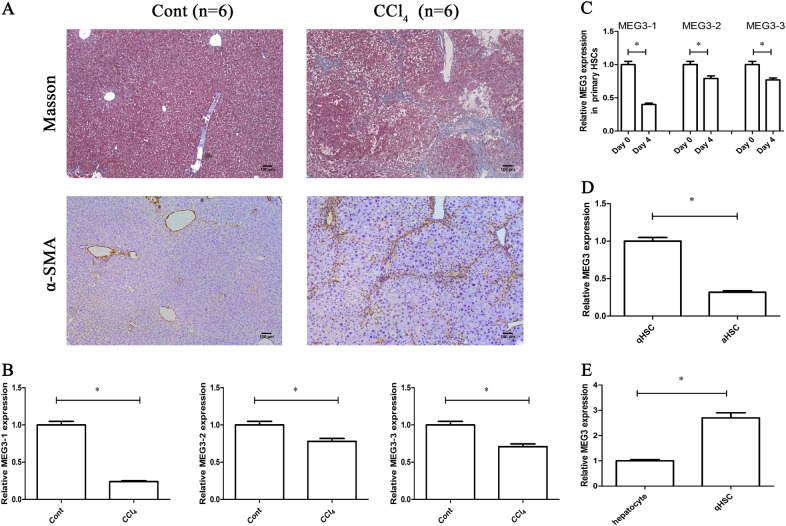
Fig. 1. Downregulation of MEG3 in liver fibrosis.
a Collagen and α-SMA were analyzed in CCl4 mice by Masson staining and immunohistochemistry, respectively. Scale bar, 100 μm. b MEG3-1, MEG3-2, and MEG3-3 expressions were detected by qRT-PCR in CCl4 mice. c Expressions of MEG3-1, MEG3-2, and MEG3-3 were analyzed in primary HSCs at Day 0 and Day 4. Primary HSCs were isolated from the livers of healthy mice. d MEG3 was analyzed in primary HSCs isolated from oil- or CCl4-treated mice. e MEG3 was analyzed in primary HSCs and primary hepatocytes from the livers of healthy mice. *P < 0.05

