Figure 1.
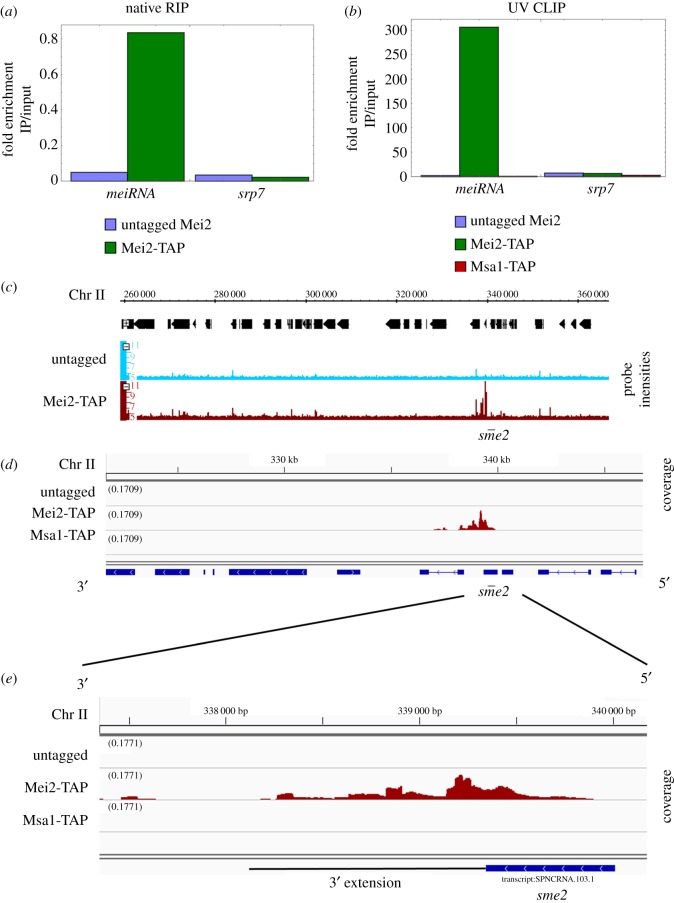
meiRNA enrichment after Mei2-TAP immunoprecipitation. (a) meiRNA enrichment after native RNA immunoprecipitation (RIP) of Mei2 shown by qRT-PCR. The y-axis shows log2 fold enrichment. srp7 is shown as a specificity control. (b) meiRNA enrichment after UV cross-linking immunoprecipitation (CLIP) by qRT-PCR is shown. srp7 is shown as a specificity control. (c) Integrated Genome Browser view of the sme2 locus after RIP-CHIP. (d) Integrative Genomics Viewer snapshot of the sme2 locus after CLIP-Seq. (e) CLIP-Seq coverage reads at the sme2 locus. The y-axis scale is normalized for all samples in (c–e).

