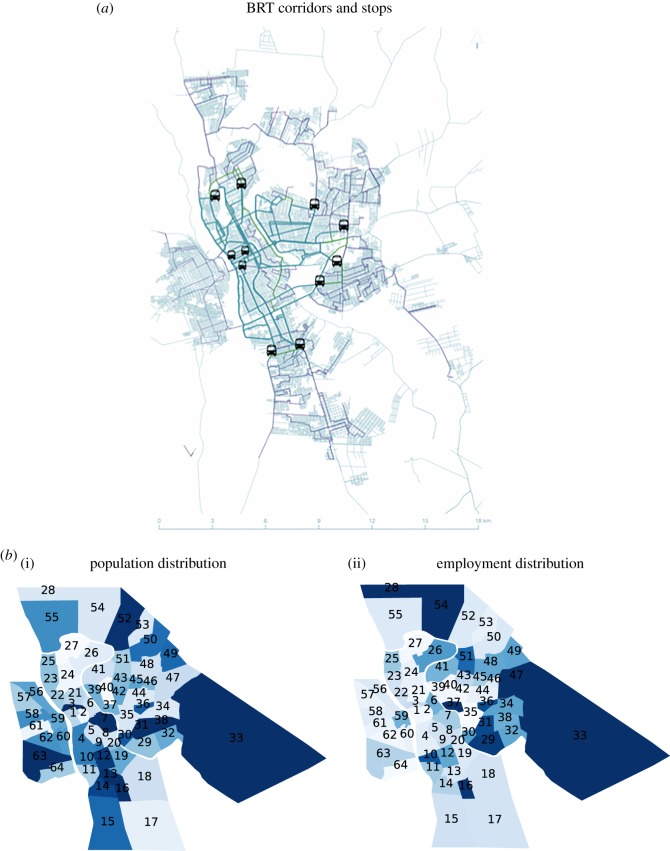
Figure 1.
(a) A map of the new BRT stops and their corridors. The BRT stops are only found in Teresina but mobility in Timon is clearly affected by the scheme. (b) A qualitative heat map of Teresina, zones 1–55, and Timon, zones 56–64, where zones are coloured according to the population (i) and employment (ii) distribution, where the values increase from white to dark blue.

