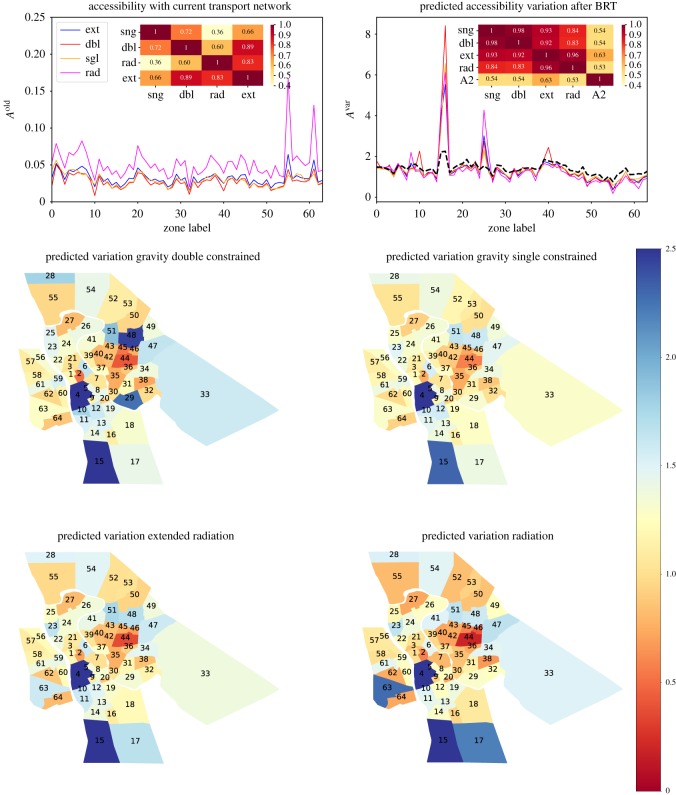
Figure 3.
In this figure, we show the accessibility to employment with Aoldi and Avari = Abrti/Aoldi on the top left and top right, respectively, for each zone of the city of Teresina and Timon. As noted in the legends of the figures, the red (double) and orange (single) curves show the results obtained from the gravity models, while the blue (extended) and magenta (normalized) curves represent the results obtained with the radiation models. The black curve in the accessibility variation is the variation measured with respect to accessibility of type 2. In the insets, we present the R2 values between the various curves. The maps in the bottom panels present the spatial distribution of Avar obtained with all the models.

