

Abstract
In this work, an untargeted metabolomic method based on ultra-high-performance liquid chromatography-quadrupole time-of-flight mass spectrometry (UPLC-QTOF/MS) in MSE (E represents collision energy) mode was exploited to determine the dynamic metabolic alterations in the plasma of male C57BL/6 mice during the onset and development of lung carcinoma. Plasma samples were collected from control and model mice (male C57BL/6 mice experimentally inoculated with the Lewis lung carcinoma cells) at 7 and 14 days post-inoculation (DPI). As a result, 15 dysregulated metabolites, including cholesterol sulphate, tiglylcarnitine, 1-palmitoylglycerophosphoinositol, 2-stearoylglycerophosphoinositol, stearoylcarnitine, PC(20:2(11Z,14Z)/16:0), PC(22:4(7Z,10Z,13Z,16Z)/14:0), PC(22:5(7Z,10Z,13Z,16Z,19Z)/14:0), PC(22:6(4Z,7Z,10Z,13Z,16Z,19Z)/16:0), 12,20-Dioxo-leukotriene B4, sphingosine 1-phosphate(d19:1-P), sphingomyelin(d18:0/16:1(9Z)), lysoPC(16:0), lysoPC(18:0) and lysoPC(20:4(5Z,8Z,11Z,14Z)), were identified in the plasma of model mice with xenografts at both 7 and 14 DPI. All the altered metabolites associated with the onset and development of lung carcinoma were involved in the metabolism of glycerophospholipid, fatty acid, sphingolipid and arachidonic acid. The feasible utility of these endogenous biomarkers as potential diagnostic indicators was validated through receiver operating characteristic curve analysis. Collectively, these findings provide a systematic view of metabolic changes linked to the onset and development of lung carcinoma.
Keywords: untargeted metabolomics, lung carcinoma, UPLC-QTOF-MS, multivariate data analysis, receiver operating characteristic curve
1. Introduction
Lung carcinoma is the most common cause of cancer mortality in China [1]. The global incidence was almost two million new cases in 2012 [2], and more than one-third of these new cases were diagnosed in China [3]. The 5-year survival rate of lung carcinoma in the early operable stage is approximately 66–82%. However, when the tumour spreads to distant sites, the 5-year survival rate drops to 6% [4]. Therefore, the early diagnosis and staging of lung carcinoma is crucial to determine treatment plans and guide disease prognosis [5]. Currently, diagnosis mainly depends on the clinical symptoms, and detection frequently occurs at an advanced stage, thus leading to a very poor prognosis. If diagnosis could be accomplished in earlier stages, the overall morbidity and mortality would dramatically change.
Recent studies have reported that low-dose computed tomography screening for lung carcinoma patients is effective to reduce the mortality of disease [6]. Nevertheless, there was a large number of individuals with undefined nodules and limitations in the resources available to identify more precise risk profiles, ideally based on minimally invasive or non-invasive means (i.e. exhaled air, phlegm, blood, etc.) [7], in conjunction with clinical symptoms, imaging, lifestyle and epidemiological information. The above diagnosis strategy could be especially applicable to individuals at risk of lung carcinoma as they may have clinical disease for years before their presentation.
Untargeted metabolomics, as an analytical tool used in combination with analytical platform and multivariate data analysis, has emerged as a reliable approach in systems biology [8]. Its objective being the comprehensive profiling of low-molecular-weight endogenous metabolites in vivo, mining the most significant metabolites that play crucial roles in biological pathways linked to disease pathogenesis and providing fundamental insights into the molecular mechanisms involved in the onset and development of diseases [9,10]. Currently, the most commonly employed analytical platforms used to profile metabolic alterations are mass spectrometry (MS) and nuclear magnetic resonance (NMR) spectroscopy. Although high-resolution NMR affords decisive structural information and quantitative analysis of metabolites in vivo, it suffers from deficiencies in chemical separation and sensitivity. In contrast, given their high accuracy, high sensitivity and specificity, and large dynamic range, high-resolution hybrids mass analysers such as Orbitrap and quadrupole time-of-flight (QTOF) MS are adequate to obtain more information in complex biological matrices [11].
Although some promising results have been studied in the metabolic alterations of lung carcinoma [12–14], there is still a lack of a systematic understanding of biological information during the onset and development of lung carcinoma in vivo, such as a wide range of metabolic levels, which is pivotal to illustrate the pathology of the disease. Therefore, a comprehensive method for the detection of the onset and development of lung carcinoma requires broad metabolites in the more representative set of biological matrices that could provide a basic consideration for the discovery of biomarkers. Peripheral blood (plasma or serum), the most commonly used biological matrix in untargeted metabolomics, possesses a huge amount of metabolite information and has been shown to delineate the entire pathophysiological mapping for the early stages of some oncological diseases [15]. In this study, an untargeted metabolomic method based on ultra-high-performance liquid chromatography (UPLC)-QTOF in MSE (E represents collision energy) mode was explored to globally profile and identify the specific and reliable endogenous biomarkers linked to the onset and development of lung carcinoma in male mouse plasma. Both multivariate data analysis and univariate statistics were used to detect the reproducibility of the analysis based on the detected ionic strength and by rapidly mining the interesting metabolites. Finally, modules of enrichment analysis and metabolic pathway analysis were employed to elucidate the possible biological mechanisms of the endogenous biomarkers associated with the onset and development of lung carcinoma.
2. Experimental procedures
2.1. Chemicals and reagents
Chromatographic-grade formic acid was purchased from SIGMA Chemical & Co (St Louis, USA). MS grade acetonitrile and methanol were purchased from MERCK & Co., Inc. (Darmstadt, Germany). Ultra-high purity water was produced through Millipore-Q purification system (Bedford, USA).
2.2. Tumour strain
The Lewis lung carcinoma tumour strains were purchased from the cell repository in the Biological Sciences Institute of Shanghai and then cultured in Dulbecco's modified Eagle's medium/high glucose (37°C) in a saturated humidity incubator containing 5% CO2 [16].
2.3. Animal model
All protocols and care of the mice were performed in strict compliance with Guidelines for the Use of Laboratory Animals (National Research Council) and authorized by the Animal Care and Use Committee of Anhui University of Chinese Medicine. Thirty male C57BL/6 mice (eight weeks old) were bought from the Animal Center of Anhui Medical University (Hefei, China). All C57BL/6 mice were acclimated at 55 ± 10% humidity and 20 ± 0.5°C on a reverse 12/12 h lamp switching cycle in an animal breeding room under specific pathogen-free (SPF) conditions. Sterilized chow and purified water were provided ad libitum. Mice were adapted for one week prior to the initial experiment. To establish xenograft tumours of Lewis lung carcinoma, Lewis lung carcinoma cells (2 × 10⁶) were inoculated into the right forelimb of each mouse by subcutaneous injection (S.C.) [17]. After the implantation, 20 model mice were randomized into two groups: a 7-day post-inoculation (DPI) model group and 14 DPI model group. Sarcoma growth was monitored every 7 days. The Vernier scale calliper was used to measure perpendicular diameters of the sarcoma. The sarcoma volume was calculated as follows: sarcoma size = long diameter × (short diameter)2/2.
2.4. Sample collection and preparation
All mice were fasted overnight before sample collection. Ten mice in each group were anaesthetized and sacrificed. Blood was collected through the retro-orbital area into heparin anticoagulation tubes. Then, the tubes were centrifuged at 2500g for 6 min at 4°C to obtain the plasma. The mice were executed, and sarcomas were dissected and weighed. Volumes of 100 µl plasma were aliquoted and transferred to 1.5 ml Eppendorf (Ep) tubes. At the same time, a quality control pooled (QCP) sample was prepared by mixing 10 µl of each test sample.
Small molecule metabolites were extracted from plasma fractions after adding methanol to remove macromolecules [18]. Frozen samples were thawed at 4°C for 0.5 h. Then, 100 µl aliquots of plasma were deproteinized with 400 µl cold methanol in a 1.5 ml Ep tube and vortex mixing for 60 s. The mixture was centrifuged at 13 000g for 5 min at 4°C. The supernatant was obtained and filtered via a microporous membrane (0.22 µm) and transferred into a sampling vial. A 2 μl aliquot of each vial was injected for the following UPLC-QTOF/MS analysis.
2.5. Chromatographic and mass spectrometric conditions
The analysis was performed on an ACQUITY I-Class UPLC equipment coupled with a Xevo G2-XS QTOF/MS detector (Waters Corp. Milford, MA, USA) via an electrospray interface. The chromatographic separation of all samples was performed on an ACQUITY UPLC BEH C18 column (Waters Corp.) (dimension 100 × 2.1 mm, 1.7 µm particle size). The temperature of column and auto-sampler were maintained at 48°C and 4°C, respectively. The UPLC system runs a gradient elution program consisting of water with 0.1% formic acid (solvent A) and acetonitrile (solvent B). The linear gradient was optimized and described as follows: 0 min, 8% B; 4 min, 40% B; 19 min, 85% B; 24–26 min, 95% B; 27–30 min, 8% B, which was delivered at 0.2 ml min−1.
Mass spectrometry analysis was conducted in positive and negative ion modes. The optimized conditions of QTOF/MS were: capillary voltage, 3.0 kV/−2.5 kV; source temperature, 120°C; sampling cone, 40 kV; cone gas flow, 50 l h−1; desolvation temperature and flow rate were 350°C and 600 l h−1; scan range, 50–1200 m/z; data acquisition rate, 0.5 s. MSE model was selected for acquisition: the lower collision energy was 6 V, the higher collision ramp energy was 15–40 V. To ensure the accuracy, the m/z values of all ions acquired in the QTOF/MS were real-time adjusted by LockSpray. Leucine-enkephalin was selected as lock mass compound for positive ion mode ([M + H]+ = 556.2771) and negative ion mode ([M − H]− = 554.2615). In order to balance the UPLC-MS system, the QCP sample was repeatedly injected three times before the formal sampling to ensure system equilibrium. And then it was injected again at the beginning, re-injected at every five samples and at the end of the sample collection (total of seven injections) to further monitor the reproducibility of the analytical platform.
2.6. Data processing and analysis
The raw data were acquired using Masslynx 4.1 Workstation UPLC-QTOF/MS Acquisition software (Waters Company, Milford, MA, USA) in non-targeted mode. After acquisition, QTOF/MS raw data were imported to Progenesis QI v. 3.0.3 software for automatic data processing [19]. The detailed workflow for data processing and analysis included retention time correction, experimental design set-up, peak picking, normalization, deconvolution, the identification of compounds and statistics. Retention time (tR)–m/z datasets were used to characterize the detected ions. The ‘30% rule in QCP samples’ and ‘80% rule in test samples’ were used to filter the consistent ions [20].
Then, the generated tR–m/z datasets and their corresponding ion intensities were further exported to EZinfo for multivariate data analysis. Principal component analysis (PCA) was employed to validate the technical reproducibility of the analytical approach and visualize the clustering, trends and outliers among the variables [21]. Orthogonal partial least squares discriminant analysis (OPLS-DA) was applied to screen differential variables responsible for the differentiation between the groups after Pareto scaling [22].
The loading-plots and S-plots generated from the OPLS-DA model were employed to visualize the relative importance of the differential variables and acquire a list of peak indices. Variables at VIP (variable influence on projection) with a value larger than 1.0 and fold change larger than 1.2 were selected and further input into Welch's t-test to test the meaning of each feature. The areas under the receiver operating characteristic curves (ROC) were employed to assess the significance of the biomarkers [23]. In general, only tR–m/z pairs with VIP > 1, fold change > 1.2 and p < 0.05 were considered as the potential biomarkers.
To identify the chemical structures of the metabolites, the accurate m/z was first derived to match the metabolite from the online Metlin [24], HMDB [25] and LipidBlast [26] databases. A potential biomarker was sieved out when the difference of the parent and fragment ions between the detected and calculated exact mass was no more than 5 ppm.
3. Results and discussion
3.1. Characteristics of Lewis lung carcinoma mice
The mice in the control group did not exhibit any distinct pathological alterations and signs during the overall course of the experiment. However, Lewis lung carcinoma mice displayed time-dependent growth following the development of tumours. The sarcoma weights and volumes of the control, 7 DPI and 14 DPI group are shown in figure 1.
Figure 1.

The sarcoma weights (a) and volumes (b) of the control, 7 DPI and 14 DPI group.
3.2. Optimization of the conditions of UPLC and QTOF/MS
In order to acquire better UPLC separation and peak shape of endogenous metabolites in mouse plasma, different mobile phase compositions and stationary phases were initially screened. It was found that the ACQUITY UPLC BEH C18 (100 × 2.1 mm, 1.7 µm) column proved better resolution and stronger retention ability for peaks of metabolite. To improve the resolution and enhance the peak shapes, 0.1% formic acid was selected in UPLC separation. Aiming to obtain better sensitivity for the endogenous metabolites in QTOF/MS spectra, the parameters of electrospray ionization including capillary voltage, source temperature, desolvation temperature and flow rate were tested. The parameters of QTOF/MS were optimized as follows: the temperature and flow rate of desolvation was 350°C and 600 l h−1, respectively; capillary voltage was 3.0 kV and −2.5 kV in positive and negative ion mode, respectively; ion source temperature was 120°C. After optimization of QTOF/MSE parameters, Function 1 (collision energy set as 6 V) was employed to acquire the total ion current (TIC) chromatograms and Function 2 (collision energy ramping from 15 to 40 V) was used to obtain the fragment ions for different subclasses of endogenous metabolites in male mouse plasma. The representative TIC chromatograms of endogenous metabolites in male mouse plasma acquired in positive and negative ion modes are displayed in electronic supplementary material, figure S1.
3.3. Technical reproducibility of the analytical approach
The reproducibility of data in metabolomics experiments is very important to guarantee more reliable results. To ensure the data quality of UPLC-QTOF/MS, the periodic injection of QCP samples throughout the entire analysis was adopted as a method to guarantee quality in metabolic profiling. QCP sample has a number of merits, including being closest to the matrices of the biological sample and offering a dataset to assess the technical reproducibility of the analytical method [27].
After data processing by Progenesis QI v. 3.0.3 software, 7193 and 5720 compound ions could be obtained in the positive and negative ion modes, respectively. More than 88.5% (6365 compound ions) and 83.9% (4800 compound ions) of variables were acquired by filtering peaks with CV less than 30% in the positive and negative ion modes, respectively. Then, the screened variables were subjected to EZinfo for multivariate data analysis. The score plots of PCA displayed the tightly clustered QCP samples and supplied pattern distinction for the 7 DPI model group, 14 DPI model group and control group in the positive (figure 2a) as well as negative ion modes (figure 2c), indicating their good analytical reproducibility throughout the experiment and confirming that variables observed in the sample were non-systematic but biologically relevant. In addition, the score plots of PCA showed that the 14 DPI model group exhibited a more obvious discrete tendency towards the normal mice from that of the 7 DPI model mice, showcasing a disease development linked to Lewis lung carcinoma. Hotelling's T2 Range plot was used to further check the quality of data. Hotelling's T2 Range plot (a value higher than the red line is a serious outlier) was employed to capture serious outliers in datasets and observe the effect of running order in positive as well as negative ion modes (figure 2b,d). Obviously, there was no serious outlier in all the samples. The score plots of PCA and Hotelling's T2 Range plots demonstrated that the repeatability and stability of the UPLC-QTOF/MS system were considered acceptable.
Figure 2.

PCA score plot and Hotelling's T2 Range plot of all analysed samples in the 7 DPI model group, 14 DPI model group, control group and QCP samples. PCA score plot of all analysed samples in positive ion mode (a) with the statistical parameters (R2X = 94%, Q2 = 86%) and negative ion mode (c) with the statistical parameters (R2X = 97%, Q2 = 83%). The corresponding Hotelling's T2 Range plot in positive ion mode (b) and negative ion mode (d).
3.4. Metabolic alterations between model mice and controls at 7 DPI
To better delineate the metabolic alterations in plasma between healthy mice and Lewis lung carcinoma mice, all observations obtained in the two ion modes were analysed by EZinfo. The model is considered reliable when Q2 is greater than 0.4. The score plots of OPLS-DA discriminated the 7 DPI group from the control groups in positive (figure 3a) and negative ion mode (figure 3d), respectively, which exhibited a satisfactory classification, implying that the differential metabolites contributed to good classification. The differential metabolites were visualized and filtered through the S-plots (figure 3b,e) and loading-plots (figure 3c,f) in both ion modes, respectively. In the S-plot and loading-plot, the further the distance of the differential metabolites from the original location, the higher the confidence level of the differential metabolites that contributed to the clustering observed in the score plots of OPLS-DA [28]. Then, the differential metabolites were selected from the S-plot and loading-plot in terms of the threshold of VIP values (VIP > 1.0) in OPLS-DA and p-values of Welch's t-test (p < 0.05). The heat maps displayed that the plasma metabolic states of Lewis lung carcinoma mice in the 7 DPI group deviated significantly from the corresponding controls in the positive (figure 4a) and negative ion mode (figure 4c), respectively. Thirteen and 17 differential metabolites were screened in positive and negative ion mode between the 7 DPI group and control group, respectively.
Figure 3.

Score plot, corresponding S-plot and loading-plot from the OPLS-DA model between the 7 DPI group and control group. Score plot (a) generated from the OPLS-DA model between the 7 DPI and control group in positive ion mode (R2Y = 79%, Q2 = 58%), and corresponding S-plot (b) and loading-plot (c) from the OPLS-DA model. Score plot (d) generated from the OPLS-DA model between the 7 DPI and control group in negative ion mode (R2Y = 95%, Q2 = 87%), and corresponding S-plot (e) and loading-plot (f) from the OPLS-DA model.
Figure 4.

Heat maps of the significantly differential metabolites. Hierarchical clustering was used to separate individual samples (X-axis). Y-axis represents compounds. Metabolomic profile between different groups was shown a clear separation in the heat map. Normalized signal intensities are visualized as a colour spectrum in the heat maps. Red represents high expression, and green represents low expression of the dysregulated metabolites. Heat maps showcasing the significantly differential metabolites screened from the control group and 7 DPI group in positive (a) and negative (c) ion mode. Heat maps showcasing the significantly differential metabolites screened from the 14 DPI and 7 DPI group in positive (b) and negative (d) ion mode. Yellow colour represents control samples, cyan colour indicates 7 DPI samples and rose red colour indicates 14 DPI samples.
3.5. Metabolic variations in model mice between 7 DPI and 14 DPI
As the sarcoma grew, 14 and 12 differential metabolites were screened in positive and negative ion mode between 7 DPI and 14 DPI groups, respectively. The score plots of the OPLS-DA model discriminated the 14 DPI group from the 7 DPI group in positive (electronic supplementary material, figure S2A) and negative ion mode (electronic supplementary material, figure S2D), which showed satisfactory classification, implying that the differential metabolites contributed to the good separation. The differential metabolites were visualized and filtered by the S-plots (electronic supplementary material, figure S2B,E) and loading-plots (electronic supplementary material, figure S2C,F) in both ion modes, respectively. The heat maps also showed that the plasma metabolic states of 14 DPI group mice deviated significantly from 7 DPI in the positive (figure 4b) and negative ion mode (figure 4d), respectively.
As shown in table 1, 9 dysregulated metabolites under positive ion mode and 7 dysregulated metabolites under negative ion mode were detected at all the time points. Among them, lysoPC(18:0) was detected in both ion modes. The intensity differences of 15 potential biomarkers were evaluated by one way ANOVA. All pairwise multiple comparison procedures (Student–Newman–Keuls method) were performed with SPSS v. 18.0 (SPSS Inc., USA) to calculate the p-values among the control, 7 DPI and 14 DPI groups as shown in electronic supplementary material, figure S3. The related metabolic pathways of each dysregulated metabolite were also shown in the table through the KEGG online database (www.genome.jp/kegg/pathway.html). Most of these 15 dysregulated metabolites linked to the onset and development of Lewis lung carcinoma were involved in glycerophospholipid metabolism, sphingolipid metabolism, fatty acid metabolism and arachidonic acid metabolism. The pathway analysis module (integrating enrichment analysis) in the MetaboAnalyst v. 3.6 database was used to analyse the metabolic pathway of all 15 potential biomarkers, as shown in figure 5. The metabolic pathway (impact > 0.1) was considered to be the most significant pathway linked to the onset and development of Lewis lung carcinoma. As a result, glycerophospholipid metabolism was selected.
Table 1.
Nine dysregulated metabolites under positive ion mode and 7 dysregulated metabolites under negative ion mode were detected throughout the onset and development of lung carcinoma. PC, phosphocholine; LysoPC, lysophosphatidylcholine; SM, sphingomyelin; FC, fold change.
| features (tR–m/z) | adduct | formula | compound | p-valuea | AUCa | log2(FC)a | metabolic pathway |
|---|---|---|---|---|---|---|---|
| positive ion mode | |||||||
| 11.39_496.3481 | [M + H]+ | C24H50NO7P | lysoPC(16:0) | 2.26 × 10⁻⁶ | 0.99 | −0.91 | glycerophospholipid metabolism |
| 13.95_524.3726 | [M + H]+ | C26H54NO7P | lysoPC(18:0) | 5.40 × 10⁻⁶ | 0.94 | −0.83 | glycerophospholipid metabolism |
| 23.58_703.5757 | [M + H]+ | C39H79N2O6P | SM(d18:0/16:1(9Z)) | 7.03 × 10⁻⁴ | 0.90 | −0.53 | sphingolipid metabolism |
| 24.76_786.6020 | [M + H]+ | C44H84NO8P | PC(20:2(11Z,14Z)/16:0) | 8.60 × 10⁻⁵ | 0.90 | 0.46 | glycerophospholipid metabolism |
| 22.46_760.5924 | [M + 2Na + H]+ | C46H80NO8P | PC(22:6(4Z,7Z,10Z,13Z,16Z,19Z)/16:0) | 2.66 × 10⁻⁴ | 0.84 | 1.13 | glycerophospholipid metabolism |
| 23.98_782.5676 | [M + H]+ | C44H80NO8P | PC(22:4(7Z,10Z,13Z,16Z)/14:0) | 4.79 × 10⁻⁵ | 0.96 | 1.03 | glycerophospholipid metabolism |
| 22.77_760.4027 | [2M + ACN + Na]+ | C20H28O5 | 12,20-dioxo-leukotriene B4 | 6.16 × 10⁻³ | 0.84 | −0.29 | arachidonic acid metabolism |
| 27.18_832.5924 | [2M + ACN + H]+ | C19H42NO5P | sphingosine 1-phosphate (d19:1-P) | 2.02 × 10⁻² | 0.80 | −0.76 | sphingolipid metabolism |
| 25.63_780.5592 | [M + H]+ | C44H78NO8P | PC(22:5(7Z,10Z,13Z,16Z,19Z)/14:0) | 7.32 × 10⁻⁶ | 0.99 | 1.95 | glycerophospholipid metabolism |
| negative ion mode | |||||||
| 24.52_465.3056 | [M − H]− | C27H46O4S | cholesterol sulphate | 5.46 × 10⁻⁶ | 1.00 | 1.58 | fatty acid metabolism |
| 14.46_485.2835 | [2M − H]− | C12H21NO4 | tiglylcarnitine | 6.57 × 10⁻⁶ | 0.93 | −0.49 | fatty acid metabolism |
| 10.46_1131.6713 | [2M + FA − H]− | C28H50NO7P | lysoPC(20:4(5Z,8Z,11Z,14Z)) | 0.035437 | 0.78 | −0.43 | glycerophospholipid metabolism |
| 13.91_568.3634 | [M + FA − H]− | C26H54NO7P | lysoPC(18:0) | 1.25 × 10⁻⁶ | 1.00 | −2.33 | glycerophospholipid metabolism |
| 12.97_599.3215 | [M − H]− | C27H53O12P | 2-stearoylglycerophosphoinositol | 6.08 × 10⁻⁴ | 1.00 | −1.55 | fatty acid metabolism |
| 14.60_464.3167 | [M + K − 2H]− | C25H49NO4 | stearoylcarnitine | 2.14 × 10⁻⁴ | 0.95 | −0.80 | fatty acid metabolism |
| 10.79_571.2867 | [M − H]− | C25H49O12P | 1-palmitoylglycerophosphoinositol | 6.26 × 10⁻⁴ | 1.00 | −1.47 | fatty acid metabolism |
aIndicates the comparisons between 7 DPI and control group.
Figure 5.
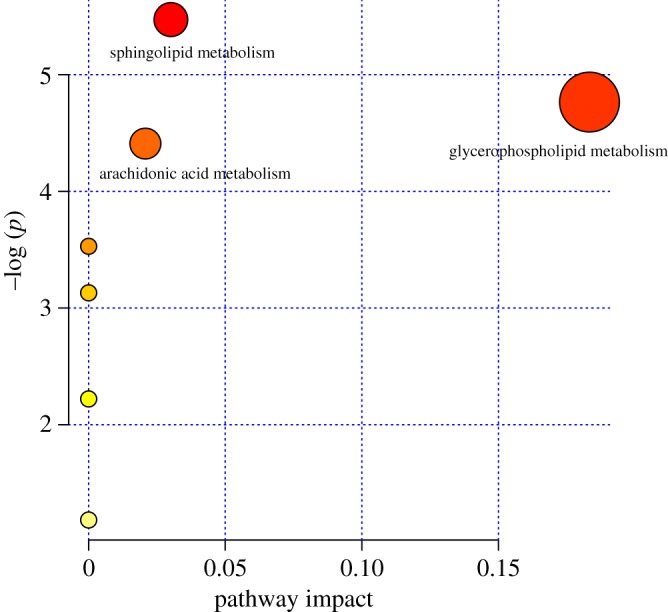
Pathway analysis of 15 dysregulated metabolites linked to the onset and development of Lewis lung carcinoma. The majority of these 15 dysregulated metabolites were involved in glycerophospholipid metabolism, sphingolipid metabolism and arachidonic acid metabolism.
3.6. Identification of potential biomarkers
Receiver operating characteristic (ROC) curve analysis produced in the MetaboAnalyst v. 3.6 was used to confirm these potential biomarkers that significantly contributed to the discrimination of Lewis lung carcinoma mice from controls. Firstly, classical univariate ROC curve analysis were employed for the quantification of the predictive value of every endogenous biomarker. Using the area under the curve (AUC) of ROC, the values of specificity and sensitivity were calculated for each endogenous biomarker. The analysis confirmed nine significantly endogenous biomarkers in positive ion mode and seven significantly endogenous biomarkers in negative ion mode with AUC greater than 0.78 between the 7 DPI and control group, the data is shown in table 1.
Then, multivariate exploratory ROC analysis was employed to evaluate the effectiveness of the combination of biomarkers for the diagnosis of Lewis lung carcinoma. The classification method and feature ranking method were support vector machines (SVM) and SVM built-ins, respectively. As shown in figure 6, the values produced in the AUC analysis were 1 (95% CI 1–1) for all nine biomarkers in positive ion mode and seven biomarkers in negative ion mode, respectively. The data illustrated that the identification of endogenous biomarkers, solely or in combination, can distinguish Lewis lung carcinoma from the corresponding controls with high accuracy and may be reliable indexes for Lewis lung carcinoma monitoring.
Figure 6.

Comparison of dysregulated metabolites based on ROC analysis in positive ion mode and negative ion mode. The ROC curves were produced by Monte-Carlo cross validation based on balanced sub-sampling. Multivariate algorithm—support vector machines (SVM) was selected as classification and feature sorting method. (a) Biomarkers detected in positive ion mode. (b) Biomarkers detected in negative ion mode. Var. (variables) represents the number of selected features.
3.7. Biological information of biomarkers for Lewis lung carcinoma
Efforts to identify the biological markers associated with Lewis lung carcinoma not only help us to understand the pathologic mechanisms of the disease but also facilitate the effective screening of patients at earlier stages. In this context, our study was the first to describe and compare the specific plasma metabolic status of Lewis lung carcinoma mice at different stages with those of healthy mice based on the analysis of a significant number of biological samples.
Phosphoglycerolipid metabolites play important roles in the pathogenesis of tumours [29]. According to previous studies, the phosphoglycerolipid metabolites, characterized by the alteration of PCs, is a crucial aspect of tumour metabolism [30]. In addition to generating more matrices for the proliferation of cells, the glycerine phosphodiesterase-mediated metabolism of glycerophospholipids could also regulate the cellular signalling pathway via downstream products and cell migration through protein kinase C signalling [31]. In this study, the specific metabolites changed by Lewis lung carcinoma were mostly involved in glycerophospholipid metabolism (increased levels of PC(20:2(11Z,14Z)/16:0), PC(22:4(7Z,10Z,13Z,16Z)/14:0), PC(22:6(4Z,7Z,10Z,13Z,16Z,19Z)/16:0) and PC(22:5(7Z,10Z,13Z,16Z,19Z)/14:0); decreased levels of lysoPC(16:0), lysoPC(18:0) and lysoPC(20:4(5Z,8Z,11Z,14Z))). The increase of PCs implied that the onset and development of Lewis lung carcinoma led to alterations in cell proliferation and migration. Lecithin-cholesterol acyltransferase (LCAT) released into the blood by the liver synthesis exists in the free form or combined with lipoprotein and plays a catalytic enzyme role in the plasma [32]. LCAT can transform PCs into lysoPCs and cholesterol ester. Lysophospholipase D can transform lysoPCs into lysophosphatidic acids [33]. The decrease of lysoPCs may be because the tumour enhanced the activity of lysophospholipase D and inhibited the activity of LCAT.
Sphingolipids are important components of membrane lipids that take part in many cellular signalling pathways [34]. Sphingosine 1-phosphate(d19:1-P) and SM(d18:0/16:1(9Z)) are mainly converted from sphingosine via sphingosine kinase and could inhibit tissue oxidative injury. The reduction of the levels of sphingosine 1-phosphate(d19:1-P) and SM(d18:0/16:1(9Z)) indicated that the onset and development of Lewis lung carcinoma inhibited the activity of sphingosine kinase and aggravated the tissue oxidative damage.
12,20-Dioxo-leukotriene B4 was the metabolite of arachidonic acid released from PCs and phosphatidylethanolamine by phospholipase A2 (PLA2), released from phosphatidylinositol via phospholipase C (PLC), or released from diacylglycerol (DAG) under the effect of DAG lipase [35]. The decrease of 12,20-Dioxo-leukotriene B4 in Lewis lung carcinoma model mice indicated that the tumour may inhibit the activity of PLC, PLA2 or DAG lipase.
1-Palmitoylglycerophosphoinositol and 2-stearoylglycerophosphoinositol belong to chemical entities known as acyl-sn-glycerol-3-phosphoinositols. These are glycophosphoinositols where the glycerol is acylated only at position O-1 or O-2 with a fatty acid, respectively [36]. Tiglylcarnitine and stearoylcarnitine belong to a class of chemical entities called acyl carnitines. Acyl carnitines are organic compounds including a chain of a fatty acid with the carboxylic acid connected to carnitine via an ester bond [37]. The four endogenous components are involved in fatty acid metabolism and participate in lipid peroxidation. The decrease of 1-palmitoylglycerophosphoinositol, 2-stearoylglycerophosphoinosito, tiglylcarnitine and stearoylcarnitine in Lewis lung carcinoma model mice indicated that the tumour may dysregulate fatty acid metabolism and promote lipid peroxidation.
Cholesterol sulphate is a sterol sulphate in mammalian plasma. It is an integral part of the cell membrane with stable functions in the membrane, supporting platelet adhesion and involving signal transduction [38,39]. This compound belongs to the class of chemicals called cholesterols and derivatives. A previous metabolomic study showed that cholesterol sulphate was increased in lung cancer cells [40]. This metabolite can also change the activity of serine proteinases of the coagulation cascade [41]. Therefore, cholesterol sulphate may promote the interaction of platelets and circulating cells, including the spread of tumour cells in the blood. In addition, cholesterol sulphate can improve the protein hydrolysis activity of matrix metalloproteinase-7, which is related to the differentiation and proliferation of tumour cells.
4. Conclusion
In this study, a reliable untargeted metabolomic method based on UPLC-QTOF/MS in MSE mode was proposed and applied to delineate metabolic changes in the male mouse plasma during lung carcinoma development. Significant metabolic alterations in the plasma levels of 9 and 7 potential biomarkers were observed in positive and negative ion mode, which were associated with the onset and development of lung carcinoma and involved in glycerophospholipid metabolism, sphingolipid metabolism, fatty acid metabolism and arachidonic acid metabolism. Collectively, the present study delineates distinct metabolic perturbations linked to the onset and development of lung carcinoma which may elucidate possible biological mechanisms of the disease.
Supplementary Material
Acknowledgements
We thank Zhiqiang Zhang, Jian Hu, Danyang Wang and Shijie Zeng for assistance with the animal experiments and sample collection, preparation. We also thank Dr Thadcha Retneswaran and reviewers, who provided useful comments that substantially improved this manuscript.
Ethics
All protocols and care of the mice were performed in strict compliance with Guidelines for the Use of Laboratory Animals (National Research Council) and authorized by the animal care and use committee of Anhui University of Chinese Medicine (approval no. A-16-038).
Data accessibility
Our data are available in an external publicly shared folder in Dryad Digital Repository: https://dx.doi.org/10.5061/dryad.1jq1313 [42].
Authors' contributions
H.W. carried out the animal experiments, participated in data analysis, carried out bioinformatics analysis, participated in the design of the study and wrote the manuscript; Y.C. participated in animal experiments and collected field data; X.L. carried out receiver operating characteristic curve analysis; Z.L. conceived of the study, designed the study, coordinated the study and helped draft the manuscript. All authors gave final approval for publication.
Competing interests
We declare we have no competing interests.
Funding
Financial support came from the Key Project of Natural Science Research of Anhui University of Chinese Medicine (no. 2017zrzd005) and National Natural Science Foundation of China (no. 81874431).
References
- 1.Hiley CT, Le Quesne J, Santis G, Sharpe R, de Castro DG, Middleton G, Swanton C. 2016. Challenges in molecular testing in non-small-cell lung cancer patients with advanced disease. Lancet 388, 1002–1011. ( 10.1016/S0140-6736(16)31340-X) [DOI] [PubMed] [Google Scholar]
- 2.Torre LA, Bray F, Siegel RL, Ferlay J, Lortet-Tieulent J, Jemal A. 2015. Global cancer statistics, 2012. CA Cancer J. Clin. 65, 87–108. ( 10.3322/caac.21262) [DOI] [PubMed] [Google Scholar]
- 3.Chen W, Zheng R, Baade PD, Zhang S, Zeng H, Bray F, Jemal A, Yu XQ, He J. 2016. Cancer statistics in China, 2015. CA Cancer J. Clin. 66, 115–132. ( 10.3322/caac.21338) [DOI] [PubMed] [Google Scholar]
- 4.Goldstraw P, et al. 2016. The IASLC lung cancer staging project: proposals for revision of the TNM stage groupings in the forthcoming (eighth) edition of the TNM Classification for lung cancer. J. Thorac. Oncol. 11, 39–51. ( 10.1016/j.jtho.2015.09.009) [DOI] [PubMed] [Google Scholar]
- 5.Navani N, et al. 2015. Lung cancer diagnosis and staging with endobronchial ultrasound-guided transbronchial needle aspiration compared with conventional approaches: an open-label, pragmatic, randomised controlled trial. Lancet Respir. Med. 3, 282–289. ( 10.1016/S2213-2600(15)00029-6) [DOI] [PMC free article] [PubMed] [Google Scholar]
- 6.The National Lung Screening Trial Research Team and Aberle DR, et al. 2011. Reduced lung-cancer mortality with low-dose computed tomographic screening. N. Engl. J. Med. 365, 395–409. ( 10.1056/NEJMoa1102873) [DOI] [PMC free article] [PubMed] [Google Scholar]
- 7.Jantus-Lewintre E, Uso M, Sanmartin E, Camps C. 2012. Update on biomarkers for the detection of lung cancer. Lung Cancer 3, 21–29. ( 10.2147/LCTT.S23424) [DOI] [PMC free article] [PubMed] [Google Scholar]
- 8.Pirhaji L, Milani P, Leidl M, Curran T, Avila-Pacheco J, Clish CB, White FM, Saghatelian A, Fraenkel E. 2016. Revealing disease-associated pathways by network integration of untargeted metabolomics. Nat. Methods 13, 770–776. ( 10.1038/nmeth.3940) [DOI] [PMC free article] [PubMed] [Google Scholar]
- 9.Wu H, Feng F. 2016. Untargeted metabolomic analysis using LC-TOF/MS and LC-MS/MS for revealing metabolic alterations linked to alcohol-induced hepatic steatosis in rat serum and plasma. RSC Adv. 6, 28 279–28 288. ( 10.1039/c5ra27910k) [DOI] [Google Scholar]
- 10.Johnson CH, Ivanisevic J, Siuzdak G. 2016. Metabolomics: beyond biomarkers and towards mechanisms. Nat. Rev. Mol. Cell Biol. 17, 451–459. ( 10.1038/nrm.2016.25) [DOI] [PMC free article] [PubMed] [Google Scholar]
- 11.Raro M, et al. 2015. Untargeted metabolomics in doping control: detection of new markers of testosterone misuse by ultrahigh performance liquid chromatography coupled to high-resolution mass spectrometry. Anal. Chem. 87, 8373–8380. ( 10.1021/acs.analchem.5b02254) [DOI] [PubMed] [Google Scholar]
- 12.An Z, et al. 2010. Integrated ionization approach for RRLC-MS/MS-based metabonomics: finding potential biomarkers for lung cancer. J. Proteome Res. 9, 4071–4081. ( 10.1021/pr100265g) [DOI] [PubMed] [Google Scholar]
- 13.Callejón-Leblic B, García-Barrera T, Grávalos-Guzmán J, Pereira-Vega A, Gómez-Ariza JL. 2016. Metabolic profiling of potential lung cancer biomarkers using bronchoalveolar lavage fluid and the integrated direct infusion/ gas chromatography mass spectrometry platform. J. Proteomics 145, 197–206. ( 10.1016/j.jprot.2016.05.030.) [DOI] [PubMed] [Google Scholar]
- 14.Mathe EA, et al. 2014. Noninvasive urinary metabolomic profiling identifies diagnostic and prognostic markers in lung cancer. Cancer Res. 74, 3259–3270. ( 10.1158/0008-5472.CAN-14-0109) [DOI] [PMC free article] [PubMed] [Google Scholar]
- 15.Issaq HJ, Xiao Z, Veenstra TD. 2007. Serum and plasma proteomics. Chem. Rev. 107, 3601–3620. ( 10.1021/cr068287r) [DOI] [PubMed] [Google Scholar]
- 16.Wang J, et al. 2017. IL-17A weakens the antitumor immunity by inhibiting apoptosis of MDSCs in Lewis lung carcinoma bearing mice. Oncotarget 8, 4814–4825. (doi:10.18632/oncotarget.13978) [DOI] [PMC free article] [PubMed] [Google Scholar]
- 17.Park BY, Min BS, Ahn KS, Kwon OK, Joung H, Bae KH, Lee HK, Oh SR. 2007. Daphnane diterpene esters isolated from flower buds of Daphne genkwa induce apoptosis in human myelocytic HL-60 cells and suppress tumor growth in Lewis lung carcinoma (LLC)-inoculated mouse model. J. Ethnopharmacol. 111, 496–503. ( 10.1016/j.jep.2006.12.023) [DOI] [PubMed] [Google Scholar]
- 18.Zhuang J, Tang X, Du Z, Yang M, Zhou Y. 2016. Prediction of biomarkers of therapeutic effects of patients with lung adenocarcinoma treated with gefitinib based on progression-free-survival by metabolomic fingerprinting. Talanta 160, 636–644. ( 10.1016/j.talanta.2016.08.007.) [DOI] [PubMed] [Google Scholar]
- 19.Zhang J, et al. 2016. An intelligentized strategy for endogenous small molecules characterization and quality evaluation of earthworm from two geographic origins by ultra-high performance HILIC/QTOF MSE and Progenesis QI. Anal. Bioanal. Chem. 408, 3881–3890. ( 10.1007/s00216-016-9482-3) [DOI] [PubMed] [Google Scholar]
- 20.Wu H, Wang D, Meng J, Wang J, Feng F. 2017. A plasma untargeted metabolomic study of Chinese medicine Zhi-Zi-Da-Huang decoction intervention to alcohol-induced hepatic steatosis. Anal. Methods 9, 586–592. ( 10.1039/C6AY02863B) [DOI] [Google Scholar]
- 21.Zhao S, et al. 2017. Chemotaxonomic classification applied to the identification of two closely-related citrus TCMs using UPLC-Q-TOF-MS-based metabolomics. Molecules 22, 1721 ( 10.3390/molecules22101721) [DOI] [PMC free article] [PubMed] [Google Scholar]
- 22.Yang Q, Lin SS, Yang JT, Tang LJ, Yu RQ. 2017. Detection of inborn errors of metabolism utilizing GC-MS urinary metabolomics coupled with a modified orthogonal partial least squares discriminant analysis. Talanta 165, 545–552. ( 10.1016/j.talanta.2017.01.018) [DOI] [PubMed] [Google Scholar]
- 23.Martin-Lorenzo M, et al. 2017. Urine metabolomics insight into acute kidney injury point to oxidative stress disruptions in energy generation and H2S availability. J. Mol. Med. 95, 1399–1409. ( 10.1007/s00109-017-1594-5) [DOI] [PubMed] [Google Scholar]
- 24.Tautenhahn R, Cho K, Uritboonthai W, Zhu ZJ, Patti GJ, Siuzdak G. 2012. An accelerated workflow for untargeted metabolomics using the METLIN database. Nat. Biotechnol. 30, 826–828. ( 10.1038/Nbt.2348) [DOI] [PMC free article] [PubMed] [Google Scholar]
- 25.Wishart DS, et al. 2017. HMDB 4.0: the human metabolome database for 2018. Nucleic Acids Res. 46, D608–D617. ( 10.1093/nar/gkx1089) [DOI] [PMC free article] [PubMed] [Google Scholar]
- 26.Kind T, Liu KH, Lee DY, DeFelice B, Meissen JK, Fiehn O. 2013. LipidBlast in silico tandem mass spectrometry database for lipid identification. Nat. Methods 10, 755–758. ( 10.1038/Nmeth.2551) [DOI] [PMC free article] [PubMed] [Google Scholar]
- 27.Dunn WB, et al. 2011. Procedures for large-scale metabolic profiling of serum and plasma using gas chromatography and liquid chromatography coupled to mass spectrometry. Nat. Protoc. 6, 1060–1083. ( 10.1038/nprot.2011.335) [DOI] [PubMed] [Google Scholar]
- 28.Wu H, Li X, Yan X, An L, Luo K, Shao M, Jiang Y, Xie R, Feng F. 2015. An untargeted metabolomics-driven approach based on LC-TOF/MS and LC-MS/MS for the screening of xenobiotics and metabolites of Zhi-Zi-Da-Huang decoction in rat plasma. J. Pharm. Biomed. Anal. 115, 315–322. ( 10.1016/j.jpba.2015.07.026) [DOI] [PubMed] [Google Scholar]
- 29.Zhan B, Wen S, Lu J, Shen G, Lin X, Feng J, Huang H. 2017. Identification and causes of metabonomic difference between orthotopic and subcutaneous xenograft of pancreatic cancer. Oncotarget 8, 61 264–61 281. (doi:10.18632/oncotarget.18057) [DOI] [PMC free article] [PubMed] [Google Scholar]
- 30.Glunde K, Jie C, Bhujwalla ZM. 2004. Molecular causes of the aberrant choline phospholipid metabolism in breast cancer. Cancer Res. 64, 4270–4276. ( 10.1158/0008-5472.CAN-03-3829) [DOI] [PubMed] [Google Scholar]
- 31.Glunde K, Bhujwalla ZM, Ronen SM. 2011. Choline metabolism in malignant transformation. Nat. Rev. Cancer 11, 835–848. ( 10.1038/nrc3162) [DOI] [PMC free article] [PubMed] [Google Scholar]
- 32.Sakurai T, et al. 2017. Development of a novel fluorescent activity assay for lecithin:cholesterol acyltransferase. Ann. Clin. Biochem. 55, 414–421. ( 10.1177/0004563217733285) [DOI] [PMC free article] [PubMed] [Google Scholar]
- 33.Tokumura A, Nishioka Y, Yoshimoto O, Shinomiya J, Fukuzawa K. 1999. Substrate specificity of lysophospholipase D which produces bioactive lysophosphatidic acids in rat plasma. Biochim. Biophys. Acta Mol. Cell Biol. Lipids 1437, 235–245. ( 10.1016/S1388-1981(99)00011-6) [DOI] [PubMed] [Google Scholar]
- 34.Zou J, Ma X, Zhang G, Shen L, Zhou L, Yu Y, Zhu F, Chen Z. 2015. Evaluation of the change in sphingolipids in the human multiple myeloma cell line U266 and gastric cancer cell line MGC-803 treated with arsenic trioxide. J. Chromatogr. B 1004, 98–107. ( 10.1016/j.jchromb.2015.09.015) [DOI] [PubMed] [Google Scholar]
- 35.Tang X, Edwards EM, Holmes BB, Falck JR, Campbell WB. 2006. Role of phospholipase C and diacylglyceride lipase pathway in arachidonic acid release and acetylcholine-induced vascular relaxation in rabbit aorta. Am. J. Physiol. Heart Circ. Physiol. 290, H37–H45. ( 10.1152/ajpheart.00491.2005) [DOI] [PubMed] [Google Scholar]
- 36.Simons K, Toomre D. 2000. Lipid rafts and signal transduction. Nat. Rev. Mol. Cell Biol. 1, 31–39. ( 10.1038/35036052) [DOI] [PubMed] [Google Scholar]
- 37.Peng M, Liu L, Jiang M, Liang C, Zhao X, Cai Y, Sheng H, Ou Z, Luo H. 2013. Measurement of free carnitine and acylcarnitines in plasma by HILIC-ESI-MS/MS without derivatization. J. Chromatogr. B 932, 12–18. ( 10.1016/j.jchromb.2013.05.028) [DOI] [PubMed] [Google Scholar]
- 38.Wang F, Beck-Garcia K, Zorzin C, Schamel WW, Davis MM. 2016. Inhibition of T cell receptor signaling by cholesterol sulfate, a naturally occurring derivative of membrane cholesterol. Nat. Immunol. 17, 844–850. ( 10.1038/ni.3462) [DOI] [PMC free article] [PubMed] [Google Scholar]
- 39.Strott CA, Higashi Y. 2003. Cholesterol sulfate in human physiology: what's it all about? J. Lipid Res. 44, 1268–1278. ( 10.1194/jlr.R300005-JLR200) [DOI] [PubMed] [Google Scholar]
- 40.Johnson CH, et al. 2017. Metabolomics guided pathway analysis reveals link between cancer metastasis, cholesterol sulfate, and phospholipids. Cancer Metab. 5, 1–9. ( 10.1186/s40170-017-0171-2) [DOI] [PMC free article] [PubMed] [Google Scholar]
- 41.Iwamori M, Iwamori Y, Ito N. 1999. Regulation of the activities of thrombin and plasmin by cholesterol sulfate as a physiological inhibitor in human plasma. J. Biochem. 125, 594–601. [DOI] [PubMed] [Google Scholar]
- 42.Wu H, Chen Y, Li Z, Liu X. 2018. Data from: Untargeted metabolomics profiles delineate metabolic alterations in mouse plasma during lung carcinoma development using UPLC-QTOF/MS in MSE mode Dryad Digital Repository. ( 10.5061/dryad.1jq1313) [DOI] [PMC free article] [PubMed]
Associated Data
This section collects any data citations, data availability statements, or supplementary materials included in this article.
Data Citations
- Wu H, Chen Y, Li Z, Liu X. 2018. Data from: Untargeted metabolomics profiles delineate metabolic alterations in mouse plasma during lung carcinoma development using UPLC-QTOF/MS in MSE mode Dryad Digital Repository. ( 10.5061/dryad.1jq1313) [DOI] [PMC free article] [PubMed]
Supplementary Materials
Data Availability Statement
Our data are available in an external publicly shared folder in Dryad Digital Repository: https://dx.doi.org/10.5061/dryad.1jq1313 [42].