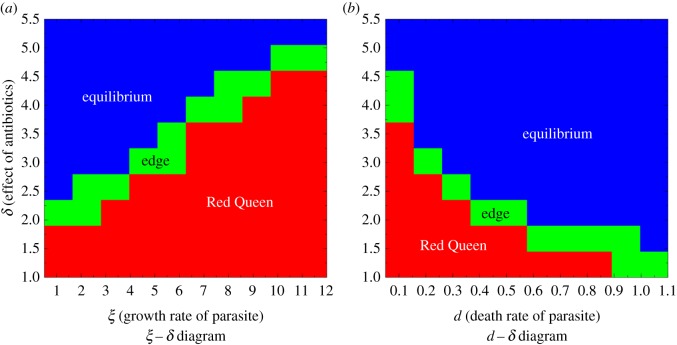
Figure 4.
Parameter diagrams showing the qualitative behaviour of host populations when varying different parasite characteristics and the level of effectiveness of the antibiotic δ. Parameters r = 4 and ρ = 0.08 are fixed. (a) Parasite growth rates (ξ) versus different levels of effectiveness of antibiotic (δ); d = 0.05. (b) Death rates of parasites (d) versus different levels of effectiveness of antibiotic (δ); ξ = 5.

