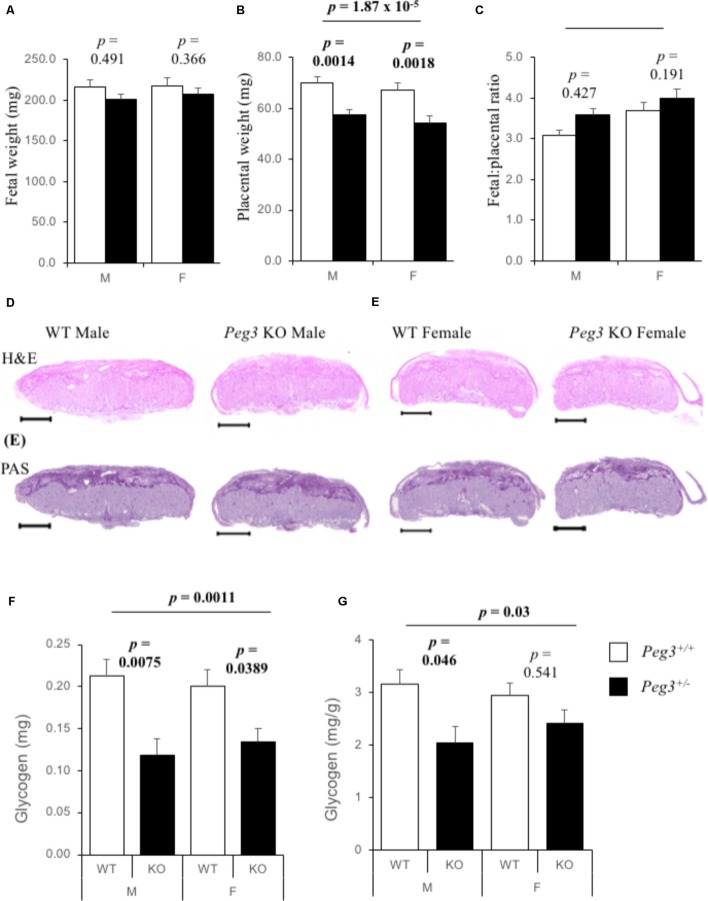
FIGURE 1.
Reduction in placental glycogen stores in Peg3 deficient placenta. (A) Wet weights of male and female WT and Peg3 KO fetuses at E14.5. No difference between WT male (N = 22), and WT female (N = 24), fetal weights, or between WT male and Peg3 KO male (N = 22), or between WT female and Peg3 KO female (N = 20), fetal weights. Data from 11 litters, litter size between 5 and 10. (B) Wet weights of WT and Peg3 KO placenta at E14.5. No difference in weight between WT male and WT female placenta. Male and female Peg3 KO placenta weighed 18 and 19% less than sex-matched WT placenta. (C) Fetal:Placental (F:P) ratios at E14.5. (D) Hematoxylin and eosin staining of male and female WT, and Peg3 KO midline placental sections at E14.5. (E) PAS staining of adjacent male and female WT and Peg3 KO midline placental sections. (F) Direct biochemical determination of total glycogen (mg) present in male and female WT and Peg3 KO placenta at E14.5. Male WT placenta contain same total glycogen as female placenta (p = 0.69). Male and female Peg3 KO placenta contain 46 and 33% less total placental glycogen than sex-matched WT placenta. (G) Glycogen expressed as mg/g placenta. Male and female Peg3 KO placenta contain 35 and 18% less placental glycogen per gram than sex-matched WT placenta. Scale bars = 1000 μm. Error bars represent SEM. Statistical significance calculated from ANOVA with Bonferroni correction. Data in Supplementary Table S1.

