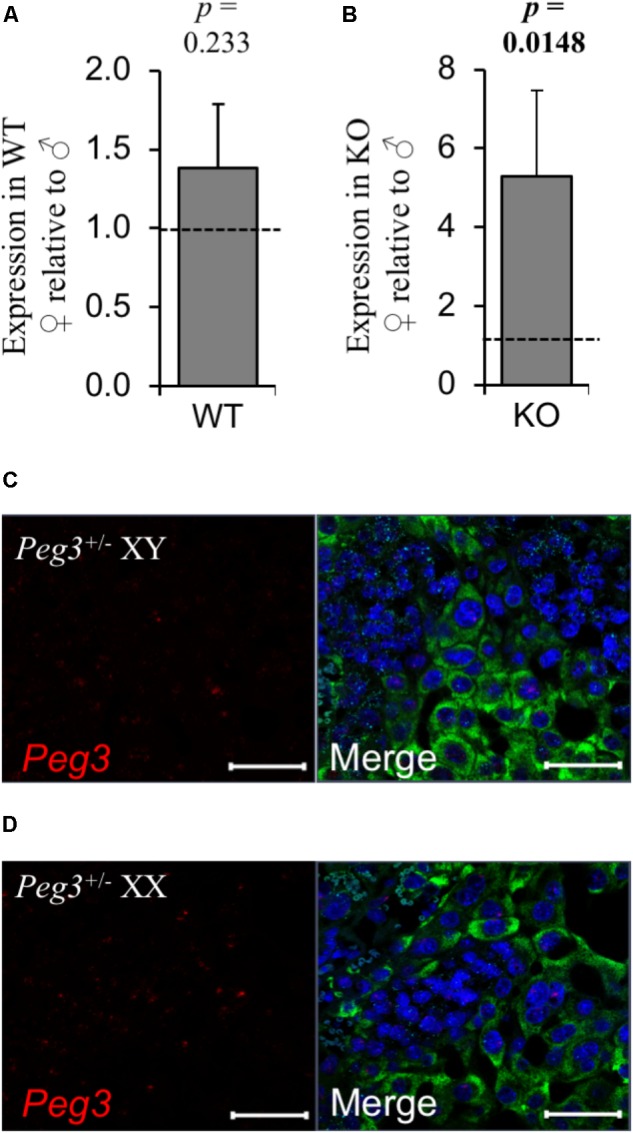
FIGURE 6.

No evidence for substantial relaxation of maternal silencing in female placenta. (A) RT-qPCR comparison of Peg3 expression between WT male and WT female placenta at E14.5. (B) RT-qPCR comparison of Peg3 expression between KO male and KO female placenta at E14.5. (C,D) High resolution image of three-plex analysis of junctional zone of male and female placenta inheriting the targeted Peg3 allele maternally (silenced). For the RT-qPCR analysis, N = 4 placenta per genotype (2 vs. 2 from 2 independent litters); error bars represent SEM. Statistical significance calculated using from ANOVA with Bonferroni correction. Data in Supplementary Table S4.
