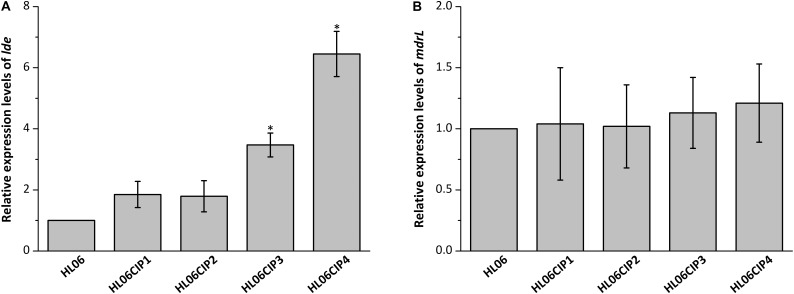
FIGURE 2.
(A) Relative expression levels of lde in HL06 and four ciprofloxacin-induced strains in BHI broth. (B) Relative expression levels of mdrL in HL06 and four ciprofloxacin-induced strains in BHI broth. Results are presented as fold changes relative to the expression levels of lde or mdrL in HL06 grown in BHI. Error bars represent the standard deviation of triplicate experiments (n = 3). The asterisk indicates a value statistically different from that of HL06 grown in BHI, with a P-value < 0.05.

