Figure 8.
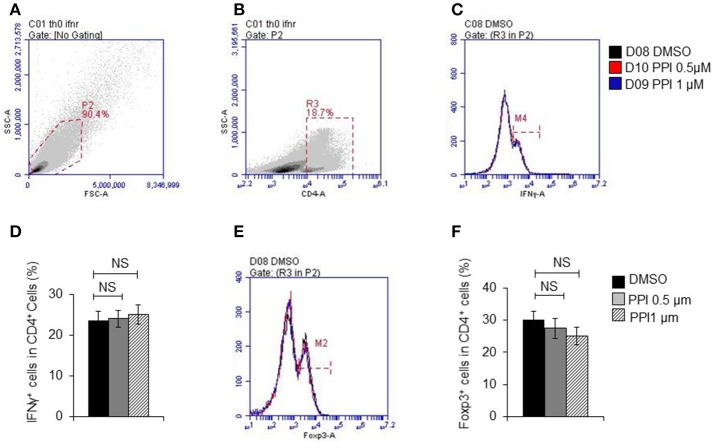
PPI did not show effect on T cell differentiation in vitro. (A) Representative images of initial gate of whole spleen cells population. (B) Representative images of CD4 positive cells. (C) IFNγ positive cells in CD4 positive cells. (D) Percentage of IFNγ positive cells in CD4 positive cells from 4 mice, (E) Foxp3 positive cells in CD4 positive cells. (F) Percentage of Foxp3 positive cells in CD4 positive cells from 4 mice. Data represent mean ± SEM. NS, P > 0.05, one-way ANOVA.

