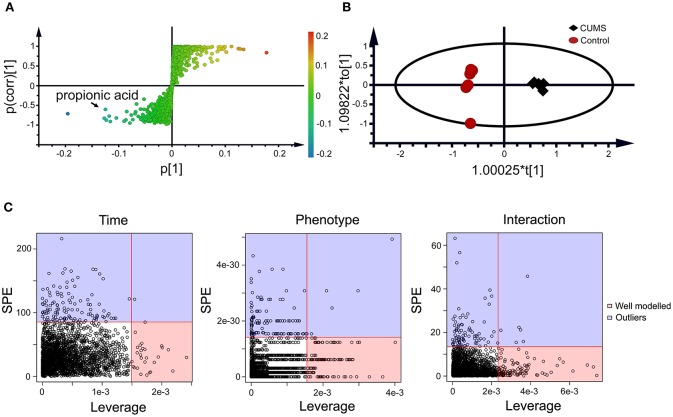
Figure 3.
Static (A,B) and dynamic (C) metabolomics analyses of the fecal metabolomes collected in the 5th week of CUMS modeling. S-Plot (A) and OPLS-DA plot (B) were used to visualize the static metabolomics analysis. Metabolites with VIP>1 and p < 0.05 were considered to be differential metabolites. Only propionic acid was labeled in the S-plot; please refer to Table 1 for detailed information on all differential metabolites identified via the static metabolomics analysis. ASCA (C) was used to analyze in the dynamic metabolomics data. Metabolites with a high leverage value and a low SPE value were considered to be differential metabolites (the well-modeled group); please refer to Table 2 for detailed information on all of the differential metabolites identified via ASCA dynamic metabolomics analysis.

