Figure 4.
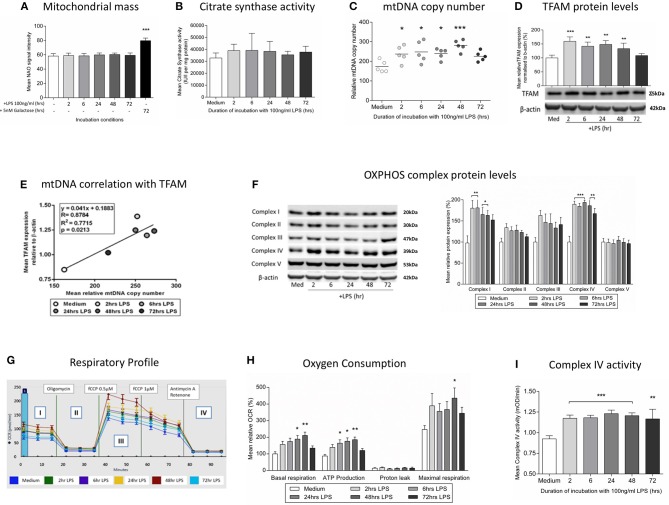
Induction of mitochondrial biogenesis following exposure of THP-1 cells to LPS. THP-1 cells were incubated with LPS (100 ng/ml) for 0–72 h before assessing mitochondrial biogenesis and respiration. (A) Mitochondrial mass was assessed by measuring the uptake of NAO using flow cytometry, (positive control - glucose-free medium supplemented with 5 mM galactose) (n = 4). (B) A colorimetric assay was used to assess the activity of the mitochondrial matrix enzyme citrate synthase (n = 3). (C) mtDNA copy number was determined by measuring MT-ND1 relative to B2M using qPCR (n = 5). (D) The level of TFAM protein relative to β-actin was determined by Western blot (n = 4). (E) Scatter plot, linear regression and Pearson's correlation of the relationship between mtDNA copy number and TFAM protein levels. *p < 0.05, **p < 0.01, ***p < 0.001. (F) Representative images of protein bands for subunits of the five mitochondrial OXPHOS complexes on PVDF membrane following Western blot and quantification of the subunits of the five mitochondrial OXPHOS complexes relative to β-actin (n = 4). (G) Representative example of the respiratory profile and (H) oxygen consumption rate for different aspects of mitochondrial respiration following exposure to LPS (100 ng/ml) for 0–72 h as determined using the Seahorse XF96e extracellular flux analyser (n = 5). (I) A colorimetric assay was used to measure the activity of OXPHOS complex IV(n = 3). The data are represented as (A) individual values with a line indicating the mean or (B,C,F,H,I) mean ± standard deviation relative to the mean in the medium control; *p < 0.05, **p < 0.01, ***p < 0.001.

