Figure 1.

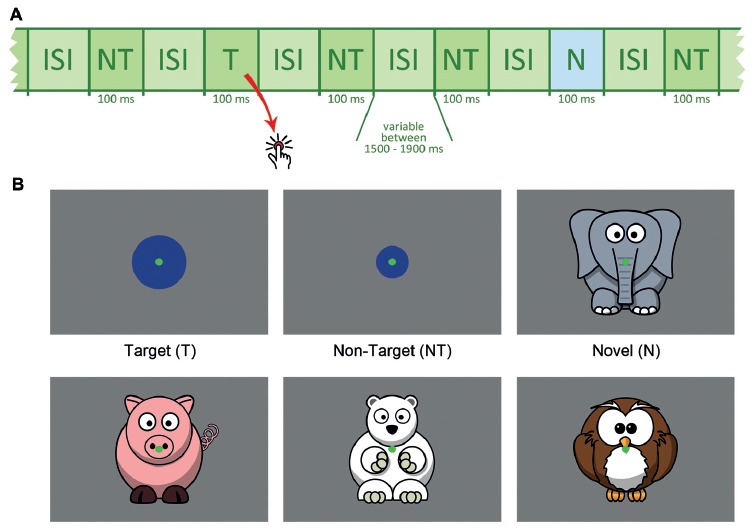
(A) Schematic presentation of the stimulus sequence, NT = non-target, T = target, N = novel, ISI = inter-stimulus interval. (B) Schematic depiction of target, non-target and novel stimuli.

(A) Schematic presentation of the stimulus sequence, NT = non-target, T = target, N = novel, ISI = inter-stimulus interval. (B) Schematic depiction of target, non-target and novel stimuli.