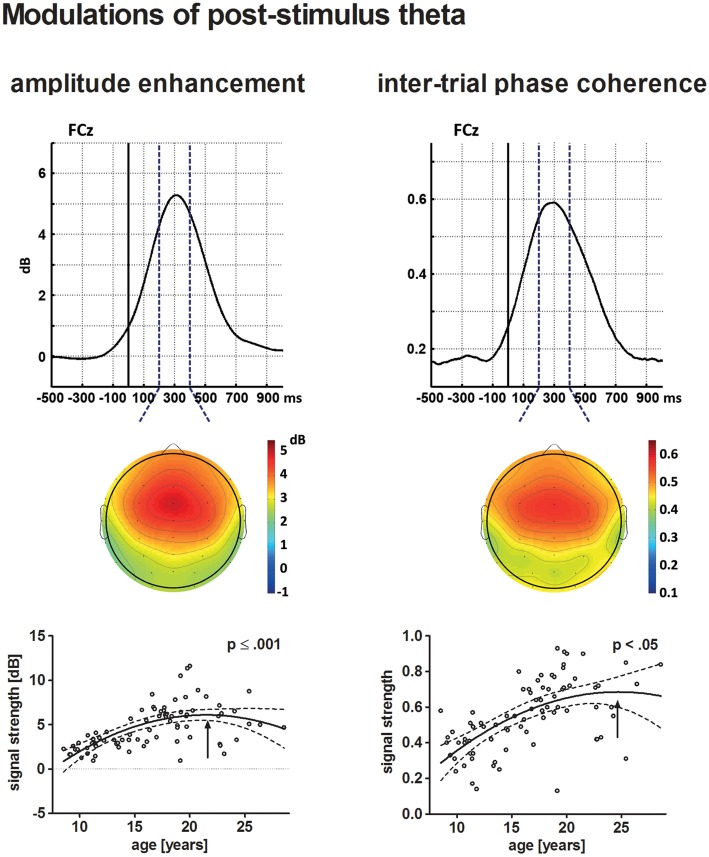
Figure 6.
The upper row depicts the averaged time courses at the electrode site FCz for theta post-stimulus amplitude enhancement (left) and tnter-trial phase coherence (ITC; right) across all participants. Topographical distributions within the time–frequency window defined for the statistical analysis (broken lines) are displayed underneath. The solid vertical line indicates stimulus onset. The lower row depicts the age-related increase of post-stimulus amplitude enhancement (left) and ITC (right) in a scatterplot (see Figure 4 for further information on scatterplots).

