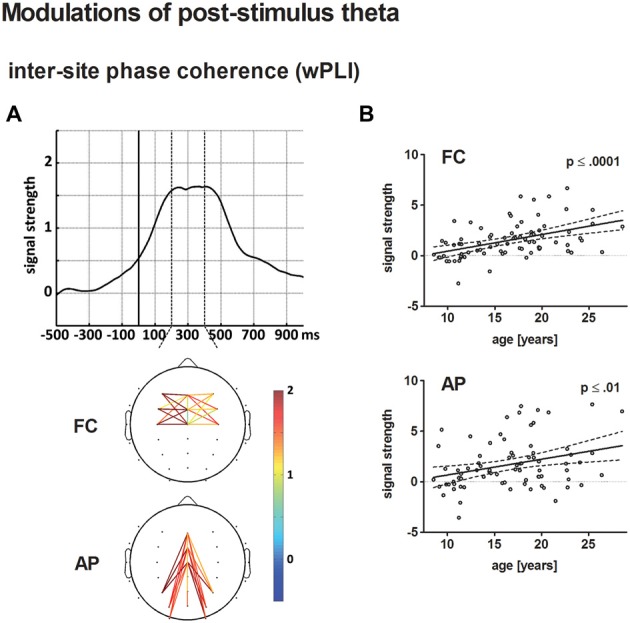
Figure 7.

(A) The top displays the averaged time course of baseline-corrected weighted phase locking index (wPLI) estimates across all electrode pairs and participants entering the statistical analysis. The solid vertical line indicates stimulus onset. The broken vertical lines indicate the time window for statistical analysis. The bottom illustrates the grand-averaged, baseline-corrected wPLI estimate for fronto-central (FC) and anterior-posterior (AP) electrode pairs according to the statistical analysis. Panel (B) depicts the age-related increase of post-stimulus wPLI estimates for FC (top) and AP electrode pairs (bottom) in a scatterplot (see Figure 4 for further information on scatterplots).
