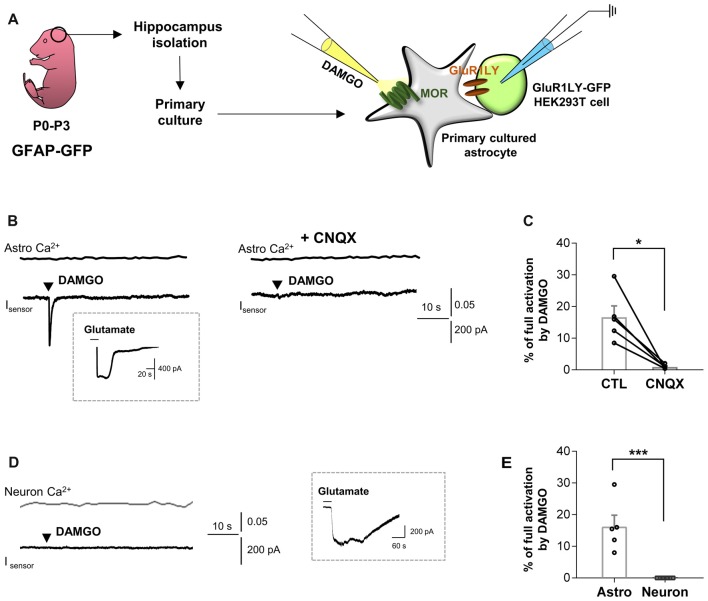
Figure 1.
μ-opioid receptor (MOR) activation elicits fast glutamate current from hippocampal astrocytes. (A) Schematic diagram for sniffer-patch with primary cultured hippocampal astrocytes prepared from GFAP-green fluorescent protein (GFP) mouse and GluR1LY-GFP-expressing HEK293T biosensor cells. (B) Ca2+ response (Astro Ca2+) induced by brief (0.1 ms) pressure application of 10 μM [D-Ala2,N-MePhe4,Gly-ol]-enkephalin (DAMGO) from a pipette in acutely dissociated hippocampal astrocyte (upper trace) and simultaneously recorded inward current (Isensor) from GluR1-L497Y expressing HEK293T cells (lower trace). DAMGO-induced inward current was inhibited by cyanquixaline (CNQX; 10 μM) application. Inset figure indicates an example trace of full activation current by bath application of 1 mM glutamate to estimate the total surface expression of GluR1-L497Y. (C) Summary bar graph for DAMGO-induced glutamate current normalized by the full activation current. The data were expressed as means ± SEM. Data from two independent mice. Paired t-test (*P < 0.05). (D) Ca2+ response (Neuron Ca2+) induced by brief (0.1 ms) pressure application of 10 μM DAMGO from a pipette in acutely dissociated hippocampal astrocyte (upper trace) and simultaneously recorded inward current (Isensor) from GluR1-L497Y expressing HEK293T cells (lower trace). Inset figure indicates an example trace of full activation current by bath application of 1 mM glutamate to estimate the total surface expression of GluR1-L497Y. (E) Summary bar graph for DAMGO-induced glutamate current normalized by the full activation current Unpaired t-test (***P < 0.001). The data of astrocytes is identical to the control group in (C). The data were expressed as means ± SEM. Data from two independent mice. Paired t-test (***P < 0.05).

