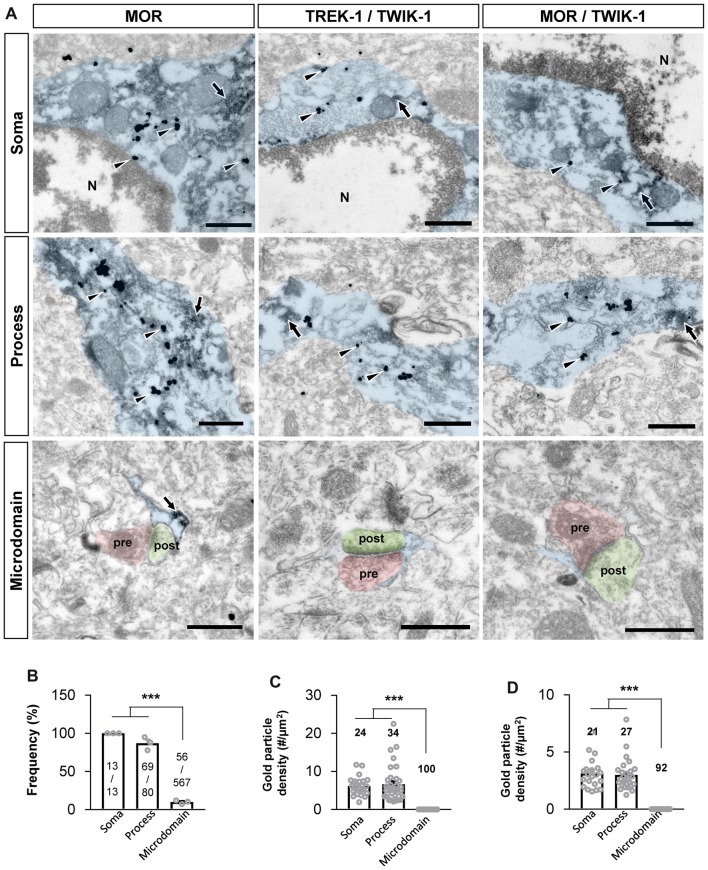
Figure 5.
MOR and TREK-1 co-localizes in astrocytic soma and process. (A) Subcellular distribution (soma, process and microdomain) of MOR in astrocyte (left). MOR is stained with immunogold with silver enhancement (dark specks, arrowheads), and GFP, representing astrocyte, is stained with immunoperoxidase (dark amorphous deposits, arrows). Cellular distribution of double labeling of TREK-1/TWIK-1 (middle) and MOR/TWIK-1 (right) in astrocyte. TREK-1 or MOR is stained with immunogold with silver enhancement (dark specks, arrowheads), and TWIK-1 is stained with immunoperoxidase (dark amorphous deposits, arrows). The soma, process, and microdomain of the astrocyte was colored blue. Presynaptic axon terminal (pre) and postsynaptic dendrite (post) were colored red and green, respectively. N is nucleus. Scale bar indicates 500 nm. (B) Summary bar graph for the frequency of MOR detection in each subcellular structure of astrocytes. Numbers in the bar graph are the number of MOR-positive soma, processes or microdomains out of total number of profiles observed. The data was collected from three animals. One-way analysis of variance (ANOVA) with Tukey’s multiple comparison test (***P < 0.001). (C,D) Summary bar graph for the gold particle density of TREK-1 (C) or MOR (D) in each subcellular structure of TWIK-1-positive astrocytes. Numbers in the bar graph indicate the number of images analyzed from three different animals. One-way ANOVA with Tukey’s multiple comparison test (***P < 0.001).

