Figure 3.

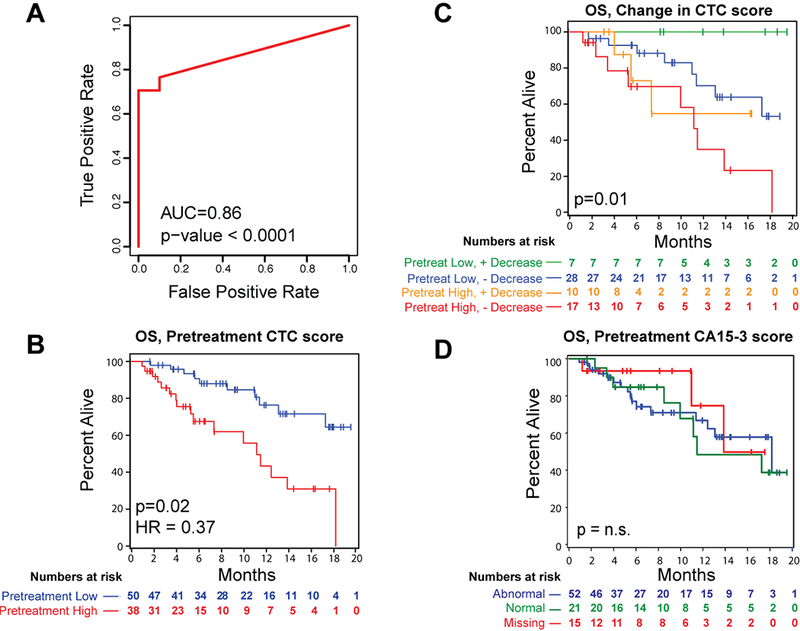
Pretreatment CTC-Score predicts overall survival in women with metastatic breast cancer receiving a new line of treatment. A, ROC analysis of total CTC signal in pretreatment samples from Stage IV patients (n= 87) from the TRACK cohort versus matched negative control (women with negative biopsies despite previously positive mammogram findings; n=10). AUC values are shown; p-values are based on Wilcoxon rank-sum test. B, Kaplan-Meier plot depicting overall survival (OS) in TRACK patients, based on pre-treatment CTC-Score. Patients were divided into two groups at a cut-off of 3000 transcripts/ml (see Methods). Patients with a high pretreatment CTC-Score (red) have a longer OS compared with those with a lower pretreatment CTC-Score (blue). Hazard ratio (HR) and p-value based on multivariable Cox proportional hazards model are shown. C, Kaplan-Meier plot depicting overall survival in TRACK patients, based on the change in CTC score between pre-treatment baseline versus 3–4 weeks on-treatment time point. Groups are defined based on low signal at pretreatment (<= 3000 transcripts/ml) with >90% reduction in signal on-treatment (green), low signal at pretreatment (<= 3000 transcripts/ml) without >90% reduction in signal on-treatment (blue), high signal at pre-treatment (>3000) with >90% reduction in signal at 3–4 weeks (orange) or high signal at pre-treatment (>3000) without >90% reduction in signal at 3–4 weeks on-treatment (red). P-value was calculated using the log-rank test. D, Kaplan-Meier plot depicting overall survival in TRACK patients, based CA15–3 levels at pretreatment. Groups are defined as abnormal CA15–3 levels (>30, blue), normal CA15–3 levels (<30, green), and missing CA15–3 levels (NA, red). P-value based on log-rank test.
