
Figure 4.
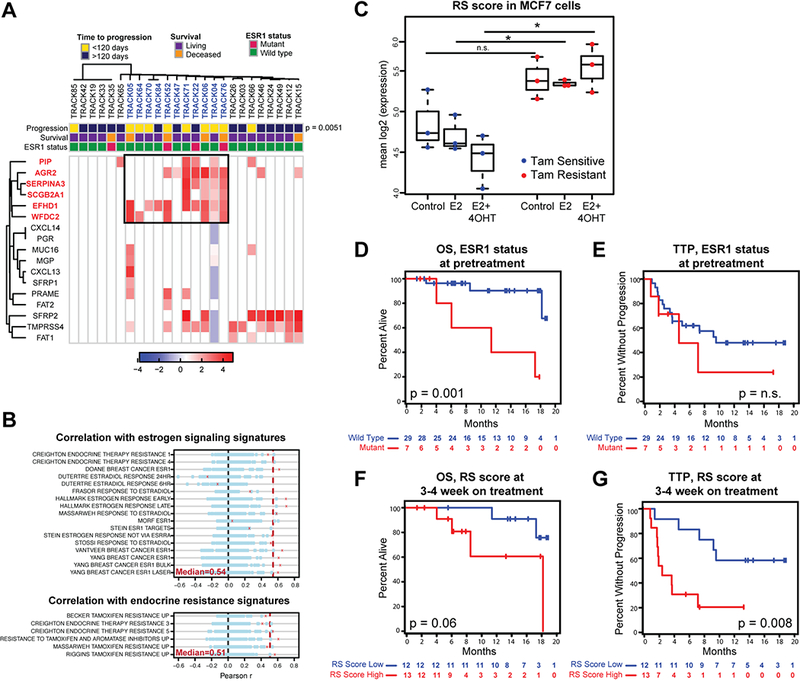
Markers associated with persistent ER signaling (RS signature) identify HR+ patients at high risk of progression on endocrine treatment. A, Unsupervised clustering of breast CTC marker expression in HR+ patients receiving endocrine therapy for 3–4 weeks. A set of markers (boxed) identifies a group of patients (colored blue) significantly enriched for progression within 120 days. P=0.0051 was calculated using Fisher’s exact test. ESR1 mutation status for each patient is shown. B, Correlations between a metascore based on the expression of the 6 high risk RS genes and GSEA signatures associated with estrogen signaling (top) and endocrine resistance (bottom) across multiple publicly available datasets are shown in red crosses. Dotted red line represents the median correlation across the multiple comparisons. Correlations with metascores based on 100 random sets of 6 genes are shown in blue circles. C, RS expression based on bulk RNAseq in tamoxifen sensitive or resistant MCF7 cells, left untreated or treated with estrogen (E2) alone or together with tamoxifen (4-OTH). Asterisks show significance of p<0.05, p-values based on two-sided t-test. D, Kaplan-Meier plots depicting OS in HR+ patients receiving endocrine therapy based on the presence of ESR1 mutations at pretreatment. Cases with ESR1 mutations (red) are compared with those with wild-type ESR1 (blue). P-values were calculated using log rank test. E, Kaplan-Meier plots depicting TTP in HR+ patients receiving endocrine therapy based on the presence of ESR1 mutations at pretreatment. Cases with ESR1 mutations (red) are compared with those with wild-type ESR1 (blue). P-values were calculated using log rank test.F, Kaplan-Meier plots of OS of HR+ patients receiving endocrine therapy based on 3–4 weeks on-treatment RS score. Groups were divided at 25 transcripts/ml. Patients with high RS CTC-Score (red) are compared with those having a low RS CTC-Score (blue). P-values were calculated using log rank test. G, Kaplan-Meier plots of OS of HR+ patients receiving endocrine therapy based on 3–4 weeks on-treatment RS score. Groups were divided at 25 transcripts/ml. Patients with high RS CTC-Score (red) are compared with those having a low RS CTC-Score(blue). P-values were calculated using log rank test.