
Figure 2: SHP2 inhibition acts upstream of RAS to abrogate MEK-I-evoked ERK MAPK pathway reactivation.
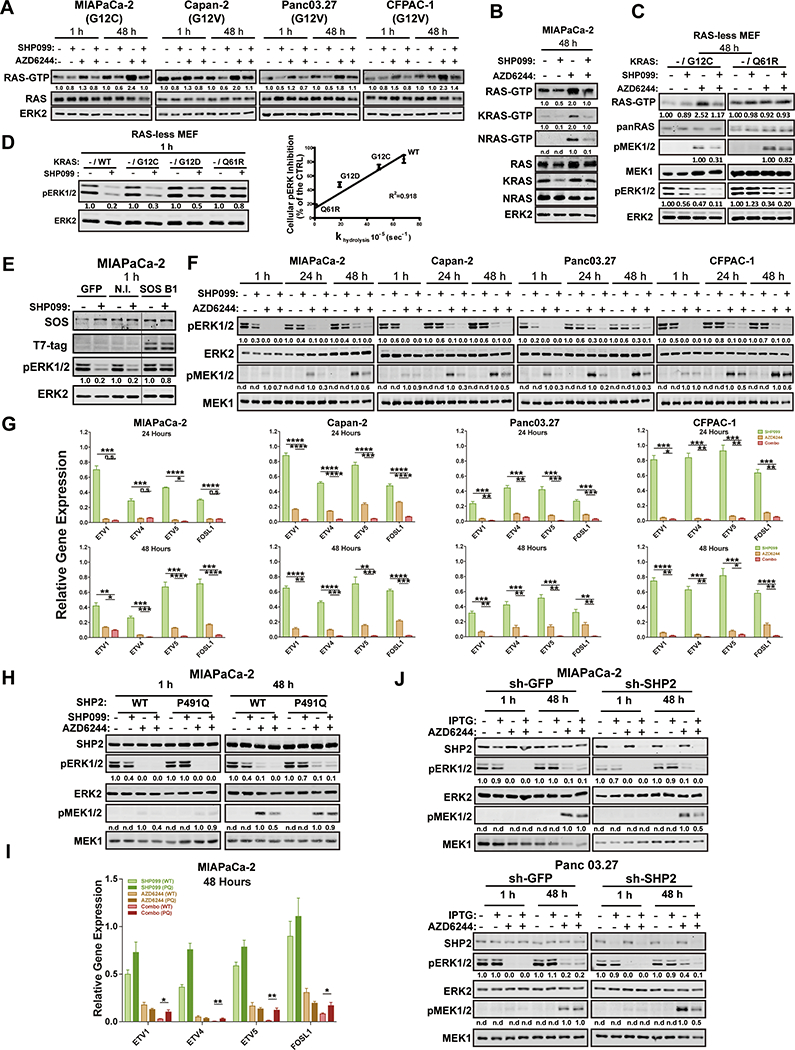
A-B, Immunoblots of whole cell lysates or GST-RBD-precipitated (RAS-GTP, KRAS-GTP and NRAS-GTP) lysates from PDAC cells treated with DMSO, SHP099 10 μM, AZD6244 1 μM, or both drugs for the times indicated. The images shown are representative of at least two independent biological replicates. C, GST-RBD pulldown assay in RAS-less MEFs reconstituted with RASG12C or RASQ61R. Total RAS, p-ERK/ERK and p-MEK/MEK were also detected in whole cell lysates prepared in modified RIPA buffer from the same cells. D, Immunoblots of whole cell lysates in RAS-less MEFs reconstituted with KRASWT, KRASG12C, KRASG12D or KRASQ61R, treated with or without 10 μM SHP099 (left). Linear regression of SHP099-induced p-ERK inhibition compared with intrinsic GTPase activity of the different KRAS mutants (from Ref. 17) in RAS-less MEFs (right). E, Effect of SHP099 on p-ERK levels in MiaPaCa-2 cells expressing a SOS1 mutant (SOS B1) that targets the SOS1 catalytic domain constitutively to the plasma membrane. Cells were incubated for 1 hour with SHP099, and lysates were immunoblotted for p-ERK and total ERK (as a loading control). F, Immunoblots of lysates from PDAC lines treated as indicated. Image shown is representative of three independent biological replicates. G, ERK-dependent gene expression (ETV1,4, 5 and FOSL1), assessed by qRT-PCR, in PDAC lines treated as indicated (*P < 0.05, **P < 0.01, ***P < 0.001, ****P < 0.0001, two-tailed t test). H, Immunoblots of SHP2, p-ERK, ERK, p-MEK and MEK from MiaPaCa-2 cells ectopically-expressing wild-type SHP2 (WT) or an SHP099- resistant mutant (P491Q), treated as indicated. I, ERK-dependent gene expression in MIAPaCa-2 cells ectopically expressing wild-type SHP2 (WT) or an SHP099-resistant mutant (P491Q), treated as in F (*P < 0.05, **P < 0.01, ***P < 0.001, ****P < 0.001, two-tailed t test). J, Immunoblot of lysates from MIAPaCa-2 (upper panel) and Panc 03.27 (lower panel) cells expressing IPTG-inducible PTPN11 (sh-SHP2) or CTRL (sh-GFP) shRNA, subjected to the indicated drugs. Numbers under blots indicate relative intensities, compared with untreated controls, quantified by LICOR.