
Figure 3: Combined MEK/SHP2 inhibition is efficacious in PDAC models in vivo.
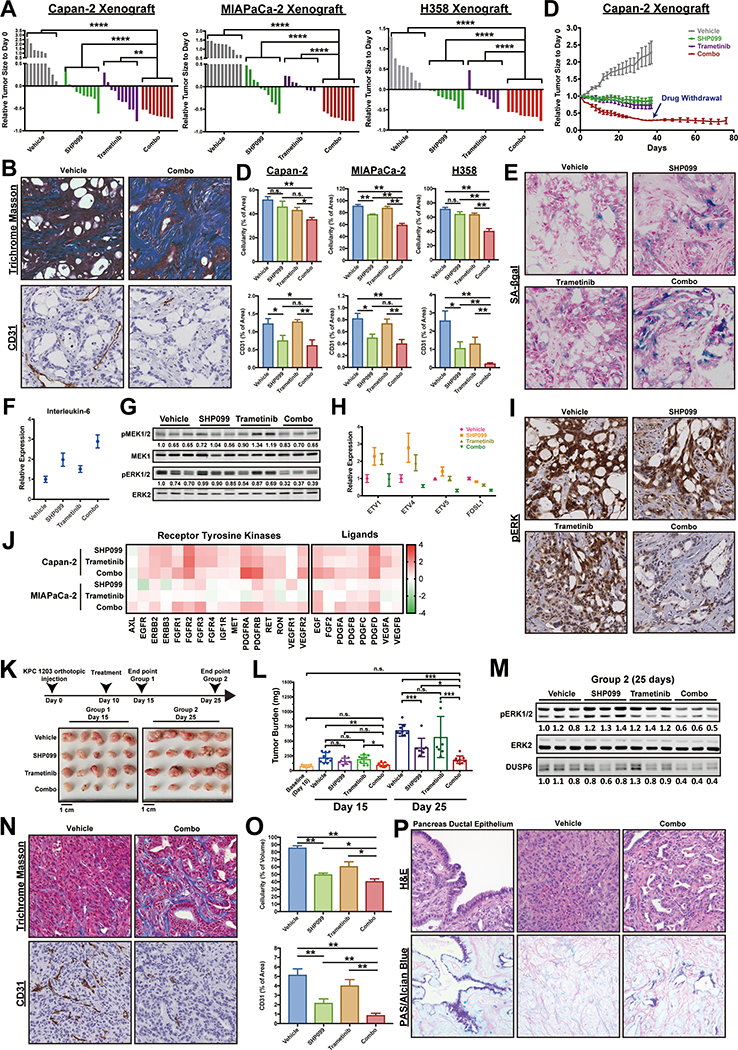
A, Response of Capan-2, MIAPaCa-2 and H358 subcutaneous xenografts to treatment with SHP099 (75 mg/kg body weight, daily), trametinib (0.25 mg/kg QD) or both drugs (trametinib 0.25 mg/kg QD; SHP099 75 mg/kg QOD). Waterfall plot shows response of each tumor after 37 days (Capan-2), 19 days (MIAPaCa-2) and 21 days (H358) of treatment; n = 8–10 mice per group. (*P < 0.05, **P < 0.01, ***P < 0.001, ****P < 0.0001, two-tailed Mann Whitney test). B, Masson Trichrome (collagen) and CD31 (blood vessels) staining in treated Capan-2 tumors showing reduced tumor cellularity and vascularity, respectively. C, Quantification of tumor cellularity (Masson Trichrome stain) and vascularity (CD31) of treated Capan-2, MIAPaCa-2 and H358 xenografts (*P < 0.05, **P < 0.01, ***P < 0.001, ****P < 0.0001, Masson Trichrome: two-tailed t test, CD31: one-tailed t test). D, Tumor growth curve of treated Capan-2 xenografts (drug withdrawal after 37 days of combo treatment). E, SA-β gal staining on treated Capan-2 tumors following 37 days of treatment. F, qRT-PCR of senescence-associated cytokine interleukin-6 in treated Capan-2 tumors. G, Immunoblot showing p-ERK and p-MEK levels in treated Capan-2 tumors. H, ERK-dependent gene expression (ETV1,4, 5 and FOSL1), assessed by qRT-PCR, in Capan-2 tumors. I, Immunohistochemical stain for p-ERK in treated Capan-2 tumors. J, qRT-PCR of RTK and RTK ligand genes in treated Capan-2 and MIAPaCa-2 tumors. K-L, Syngeneic mice injected orthotopically with KPC 1203 cells were treated with vehicle, SHP099 (75 mg/kg QD), trametinib (0.25 mg/kg QD) or both drugs (trametinib 0.25 mg/kg QD; SHP099 75 mg/kg QOD), as depicted in the scheme. Tumor size was measured at day 15 and 25 (*P < 0.05, **P < 0.01, ***P < 0.001, one-way ANOVA with Tukey’s multiple comparison test). M, Immunoblot showing p-ERK and DUSP6 levels in KPC 1203 tumors from K. N-O Masson Trichrome and CD31 staining and quantification in treated KPC tumors. P, H&E and PAS/Alcian Blue staining of treated KPC tumors. Numbers under blots indicate relative intensities, compared with untreated controls, quantified by LICOR.