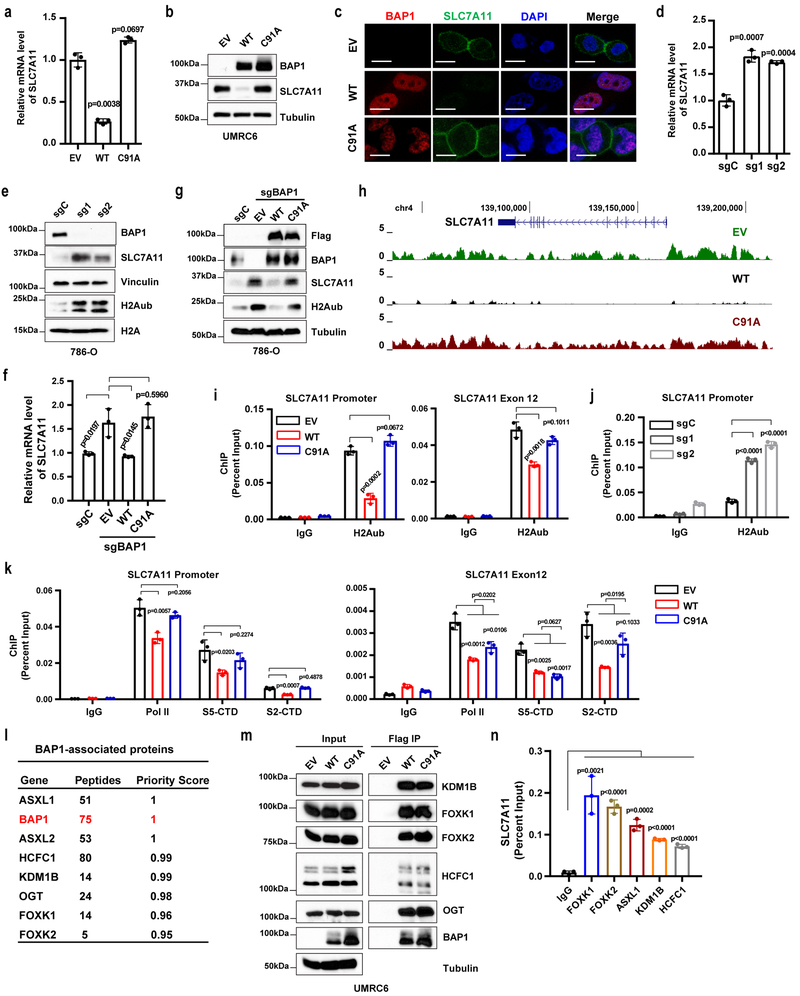
Figure 3. BAP1 suppresses SLC7A11 expression and reduces H2Aub occupancy on the SLC7A11 promoter.
a, b, SLC7A11 expression levels in indicated UMRC6 cells were measured by RT-PCR (a) and Western blotting (b). Error bars are mean ± s.d., n = 3 independent repeats (a). Experiment was repeated four times independently with similar results (d). c, BAP1 (red) and SLC7A11 (green) expression and localization in indicated cells were analyzed by immunofluorescence. Cell nuclei were labeled by DAPI (blue) staining. Scale bar, 10 µm. Experiment was repeated twice independently with similar results. d, e, mRNA and protein levels of indicated genes in indicated 786-O cells were measured by RT-PCR (d) and Western blotting (e). Error bars are mean ± s.d., n = 3 independent repeats (d). Experiment was repeated three times independently with similar results (e). f, g, mRNA and protein levels of indicated genes in indicated 786-O cells were measured by RT-PCR (f) and Western blotting (g). Error bars are mean ± s.d., n = 3 independent repeats (f). Experiment was repeated twice independently with similar results (g). h, H2Aub ChIP-Seq occupancy profiles at the SLC7A11 loci in indicated UMRC6 cells. i, ChIP-qPCR confirming the lower H2Aub binding on the SLC7A11 promoter and selected exon regions in BAP1 WT cells than in EV or BAP1 C91A cells. Error bars are mean ± s.d., n = 3 independent repeats. j, ChIP-qPCR showing the increased H2Aub binding on the SLC7A11 promoter upon BAP1 deficiency in 786-O cells. Error bars are mean ± s.d., n = 3 independent repeats. k, ChIP-qPCR analysis of RNA polymerase II (Pol II), S5-CTD, and S2-CTD binding on the SLC7A11 promoter and selected exon regions. Error bars are mean ± s.d., n = 3 independent repeats. l, Lists of BAP1 binding proteins identified by mass spectrometry. m, Interactions between indicated proteins and BAP1 were verified by Western blotting in indicated cells. Experiment was repeated twice independently with similar results. n, Bar graph showing the binding of PR-DUB proteins on the SLC7A11 promoter by ChIP-qPCR. Error bars are mean ± s.d., n = 3 independent repeats. All P values were calculated using two-tailed unpaired Student’s t-test. Detailed statistical tests were described in Methods. Scanned images of unprocessed blots are shown in Supplementary Fig. 7.

