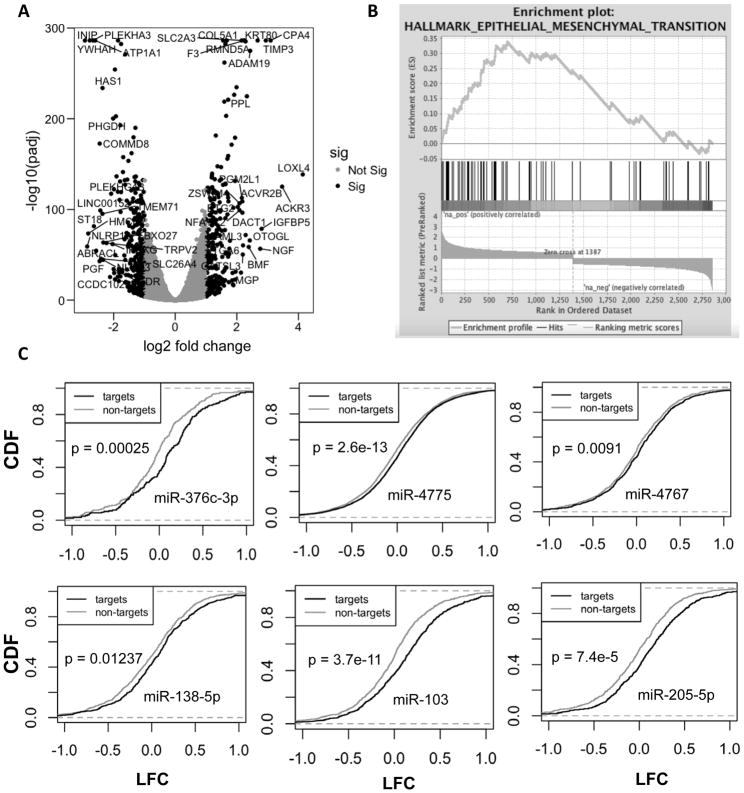
Figure 4. LINC00152 regulates genes involved in invasion in U87 cells.
A) Volcano plot of statistical significance against fold-change highlighting differentially regulated genes in black color upon siLINC00152 in U87 cells. B) Plot from gene set enrichment analysis (GSEA) showing the gene set involved in epithelial-to-mesenchymal transition (EMT) enriched among upregulated genes (left black end of spectrum) after LINC00152 knockdown in U87 cells. C) Cumulative distribution frequency plots of miRNA target mRNAs (as predicted by TargetScan: black line) or non-targets (grey line) showing fraction of genes with fold change less than that indicated on the X-axis after LINC00152 knockdown. None of the miRNAs previously proposed to be sponged by LINC00152 are released as evident from the fact that their targets are not repressed upon LINC00152 knockdown.

