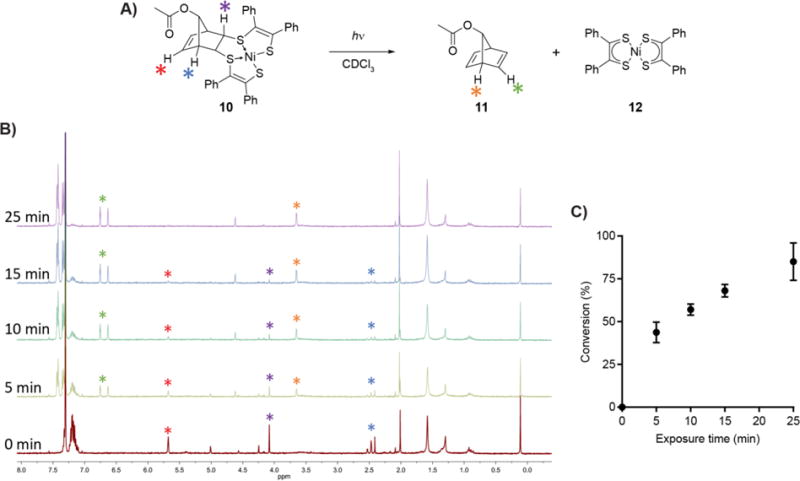
Figure 3. Photocleavage of the QC/nickel bis(dithiolene) adduct.

A) Reaction scheme for the model photocleavage. Adduct 10 was dissolved in CDCl3 to a concentration of (5 mM) and placed in a borosilicate glass tube. The solution was placed in a foil-lined container and irradiated with 365 nm light from a handheld lamp for 0-25 min. B) Representative 1H NMR spectra from Figure 3A at the indicated times. Diagnostic peaks are labeled with colors corresponding to the stars in Figure 3A. C) The progress of photocleavage was determined by comparing the integration of individual peaks of 10 to 11. Each measurement is the average of three separate experiments. Error bars represent one standard deviation.
