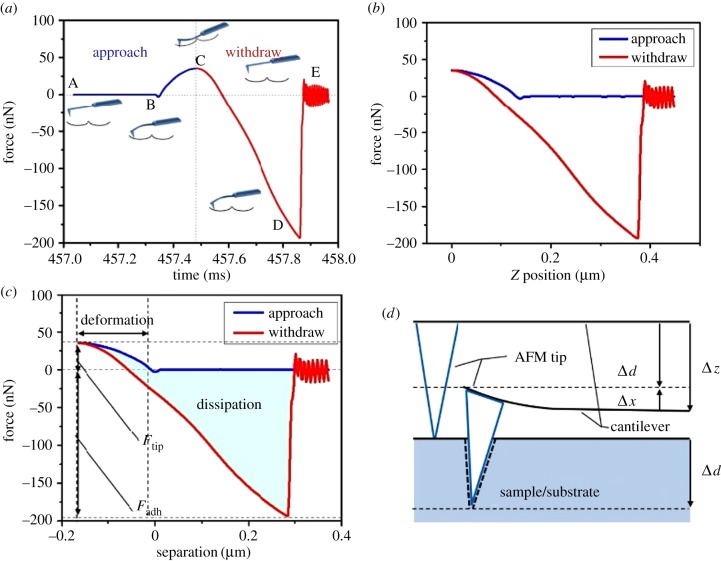
Figure 1.
(a) Plot of force as a function of time for RTESPA-300 interacting with CPr; the insets are probe–sample interactions at different points of the plot, including point (B) jump-to-contact, (C) peak force, (D) pull-off and (E) free oscillation of the probe after surface detachment. (b) Plot of force as a function of z (vertical) piezo position. (c) Plot of force as a function of probe–sample separation distance. (d) An illustration of the relationship between probe deflection (Δx) of the probe and sample deformation (Δd). (Online version in colour.)

