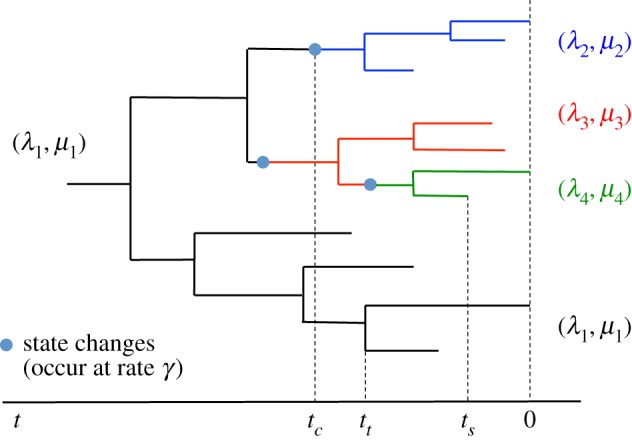
Figure 1.

Visual representation of the phylogeny under an MSBD model. Each state is represented by a colour: the ancestral state, in black, starts at the root and represent the first transmission cluster. The other states, in blue, red and green, start at change points along the tree. These states represent further transmission clusters in the course of the epidemic, and the state change points represent the introduction of the pathogen into a new community. Here tc, tt and ts are the times of, respectively, a state change, transmission and sampling event, as they appear in equation (2.2).
