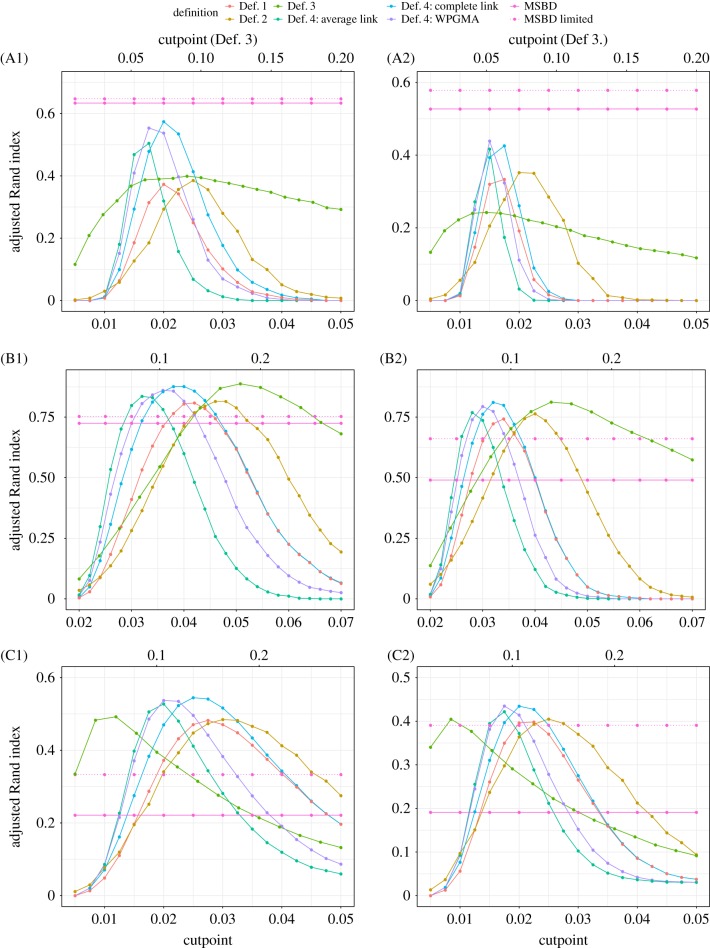
Figure 2.
Comparison of the average ARI obtained by the different clustering methods in function of the cutpoint on networks A (parts A1,A2), B (parts B1,B2) and C (parts C1,C2). For each network, the first column (part 1) shows the results for weight w = 0.25 and the second column (part 2) for w = 1. Our proposed MSBD method is not dependent on a cutpoint. The cutpoint for Definition 3. is shown on the top x-axis, the cutpoints for all other definitions are shown on the bottom x-axis.

