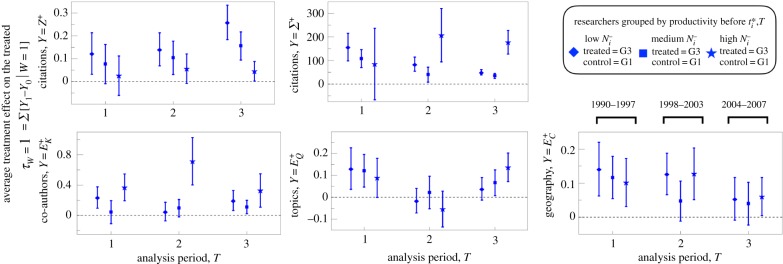
Figure 4.
Estimation of the mobility effect by productivity subgroup. Researchers were separated into three groups according to the number of publications in the pre-treatment period, N−i: low (bottom tercile, triangles), medium (middle tercile, squares) and high (upper tercile, stars). For a given variable and period of analysis T, we applied the PSM method to compare the mobile ‘treated’ group (Gi = 3) to the not-mobile ‘control’ group (Gi = 1) corresponding to the group comparison G1–G3 in figure 3. Each error bar is a point estimate with 95% confidence interval. (Online version in colour.)

