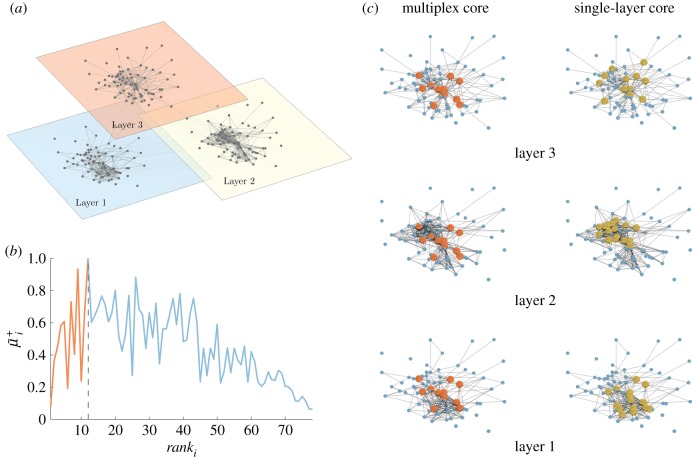
Figure 1.
An illustrative example of the multiplex rich core analysis. In panel (a), we show a multiplex social network obtained from the Top Noordin Terrorists’ contacts, with N = 78 nodes, M = 3 layers and  ,
,  and
and  , for the three layers respectively. Panel (b) shows the curve
  as a function of ranki. All nodes from rank equal to 1 up to the node with maximum
  are part of the core of the multiplex, which is shown in red colour in panel (c), first column. The cores obtained at each layer by the standard single-layer analysis are reported in yellow for the sake of comparison in the second column. The percentages of core nodes in the single layers that are in the multiplex core are 83.3% for layer 1, 66.7% for layer 2, and 58.3% for layer 3.

