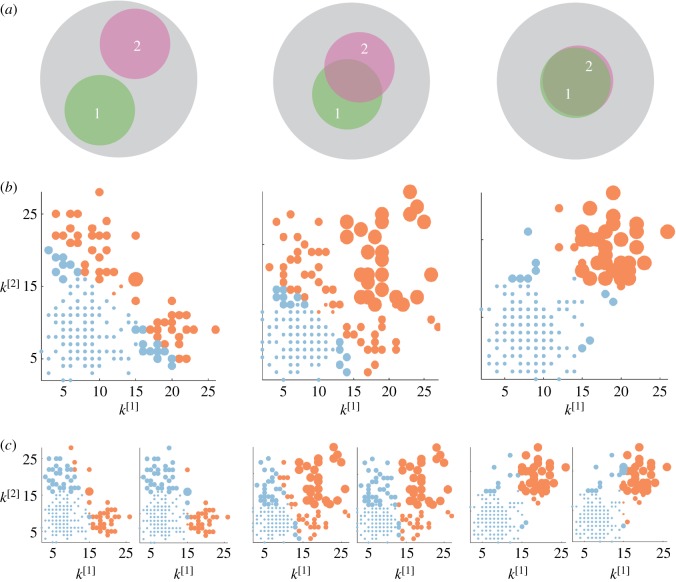
Figure 2.
Core–periphery structure in synthetic multiplex networks with different core similarity. In panel (a), we sketch multiplex networks with M = 2 layers, N = 250 nodes and different levels of core similarity, namely  (left column),
  (central column) and
  (right column). In panel (b), the nodes are placed in a two-dimensional plane according to their degree at each layer. The size of each dot is proportional to the multiplex richness μi of the node (unbiased case, c[1] = c[2] = c = 0.5). Nodes belonging to the multiplex cores are usually placed in the right-top corner of the plots and are coloured in orange, while the multiplex periphery is in blue. In panel (c), we report results obtained for two cases with
  , namely:
  where the core is biased towards the important nodes of the first layer (left), and
  , where the core corresponds to the core of the first layer (right).

