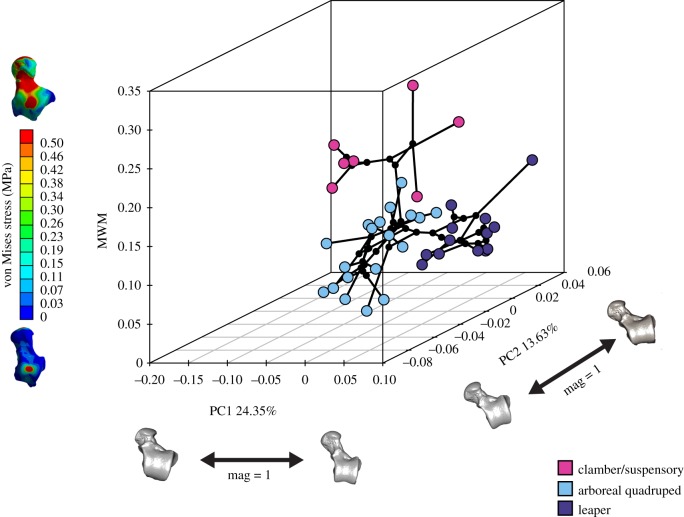
Figure 5.
Phylomorphospace of the first two morphometric PCs and stress values (MWM) as vertical z-axis. One of the models closest to the mean shape was warped to match the multivariate mean using the thin-plate spline method, and then the obtained average model was warped to represent the variation along the PC axes. In addition, the von Mises stress maps of two extreme models are displayed to facilitate the understanding of the z-axis. (Online version in colour.)

