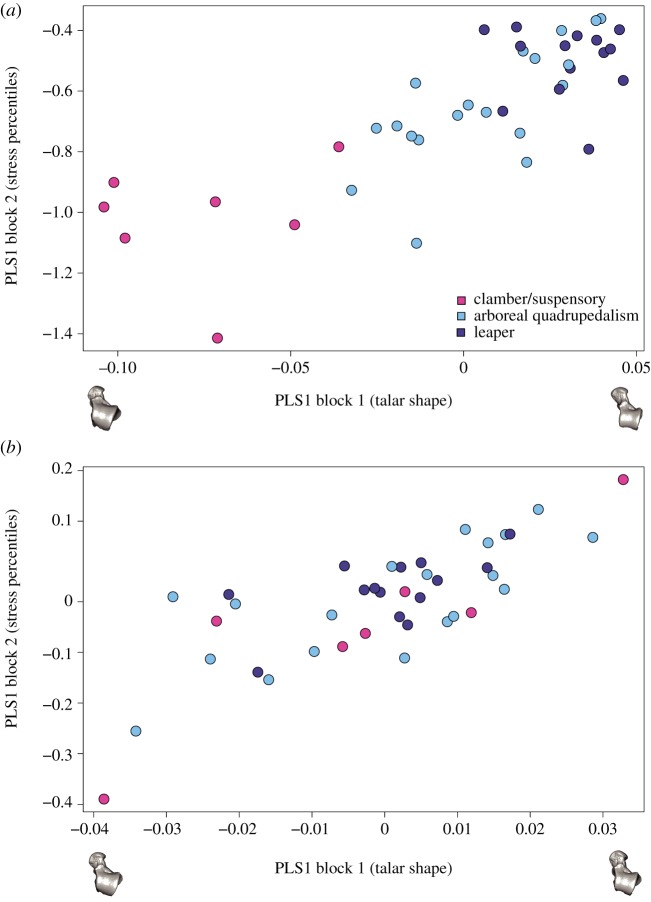
Figure 6.
(a) Standard PLS and (b) the phylogenetic PLS analysis of the shape variables and stress percentile values. One of the models closest to the mean shape was warped to match the multivariate mean using the thin-plate spline method and then the obtained average model was warped to represent the covariation between the two blocks of data for PLS1. (Online version in colour.)

