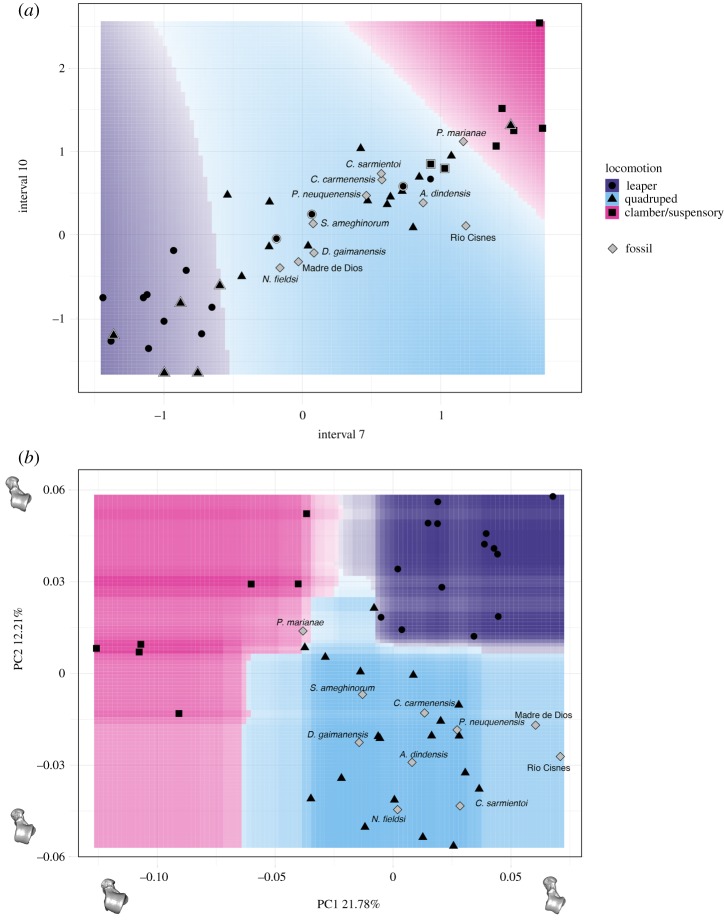
Figure 8.
Decision boundary plots for (a) biomechanical and (b) morphometric data. In (a), only the seventh and 10th intervals are displayed because they contribute the most to class separation, while in (b) only the first two PCs are shown. The space is coloured depending on what locomotor category the (a) SVM or the (b) RF algorithm predict that region belongs to, whereas the lines between coloured areas represent the decision boundaries. Colour intensity indicates the certainty of the prediction in a particular graph area (i.e. darker colours imply a higher probability of belonging to a particular class). Symbols surrounded by a white rim represent misclassified specimens. In (b), one of the models closest to the mean shape was warped to match the multivariate mean using the thin-plate spline method, and then the obtained average model was warped to represent the variation along the two PC axes. (Online version in colour).

