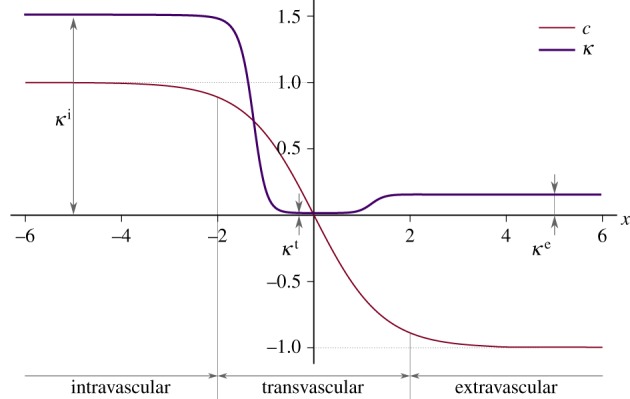
Figure 2.

Hydraulic conductivity function. We plot  as a function of
  , that is, the one-dimensional solution to the phase-field equation on an infinite domain. The phase-field creates smooth interfaces that permit the differentiation of intravascular, transvascular and extravascular regions. Accordingly, the hydraulic conductivity displays three plateaus, one per region, connected by smooth transitions. In this plot, we take κe = 0.15,
  ,
,  and λ = 1. Although these values are not realistic, we use them in the plot to enable a simple visualization of the hydraulic conductivity as a function of c.
