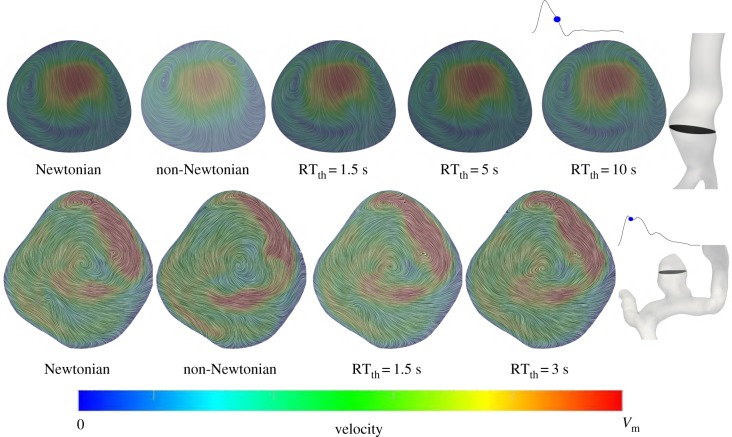
Figure 5.
Velocity vectors for the AAA (top row) and ICA aneurysm (bottom row) models at the shown cross sections and intra-cardiac time-points. Surface streamlines of the velocity vectors projected to the cross section are shown. The streamlines are coloured based on the total velocity vector. The Vm value in the colour bar range is set to 4 and 10 m s−1 for the AAA and ICA aneurysm models, respectively. The different rheology models are shown in the figure.

