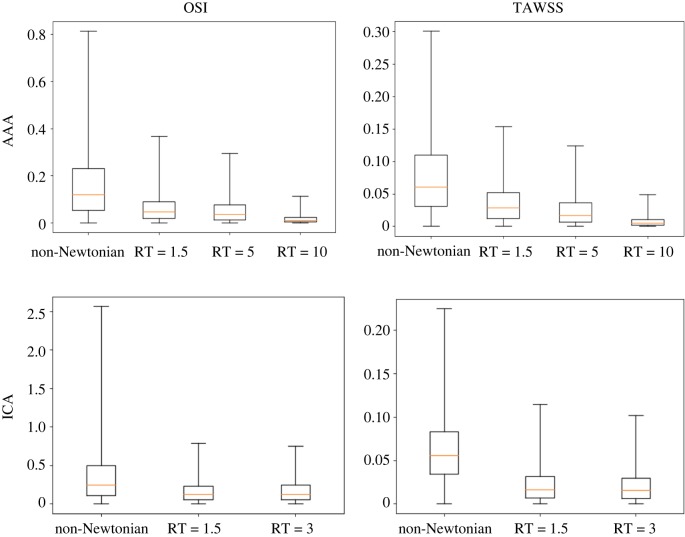
Figure 6.
Box plots of the relative point-wise change (|τ1 − τ2|/τ2) between the Newtonian model (reference model) and the other rheological models for the OSI and TAWSS results in the AAA (top row) and ICA aneurysm (bottom row) models. The median, first and third quartiles are shown in the box plots. The whiskers correspond to the minimum and 99th percentile of the data. The plots are created based on all of the computational nodes in the aneurysmal region. (Online version in colour.)

