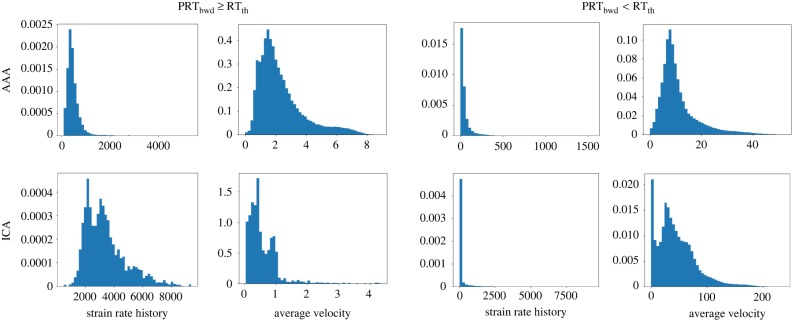
Figure 7.
Probability density histograms of the strain rate history (integrated Frobenius norm of the strain rate tensor along each trajectory) and average velocity (average velocity experienced by each trajectory) for tracers that meet the RT threshold (left panels) and do not meet the RT threshold (right panels). The histograms are based on all of the tracers released at different time-points. The AAA (top row) and ICA aneurysm (bottom row) results are shown. The RT threshold used is RTth = 5 s for the AAA and RTth = 1.5 s for the ICA aneurysm model. Strain rate history ( ) is dimensionless and the unit for velocity is cm s−1. (Online version in colour.)

