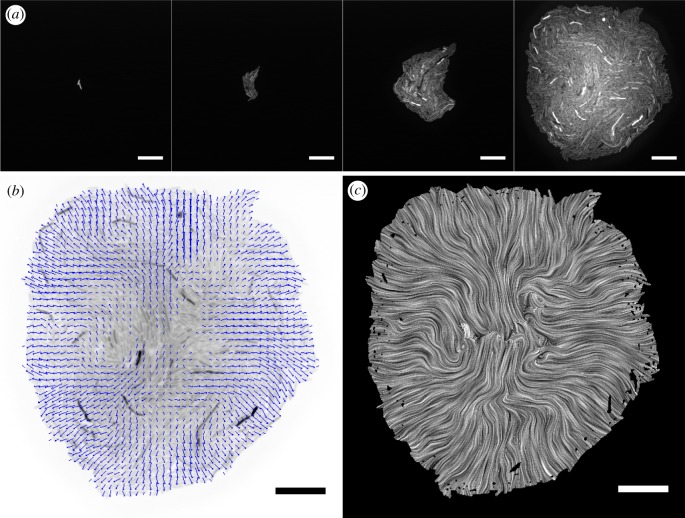
Figure 4.
(a) A montage of a growing E. coli colony with adhesive pSEG4ag plasmid and accessory pL31N in the presence of 1 mM IPTG at frame number 1, 14, 27 and 40 corresponding to 0, 130, 260 and 390 min of the time lapse. (b) The velocity field between the final frame of panel (a) and the preceding time point, obtained by the optical flow algorithm overlaid with blue arrows, where the arrows represent the distance moved in 10 min. (c) The same velocity field as in (b), visualized over the colony with the line integral convolution (LIC) technique [50]. Scale bars, 20 μm.

