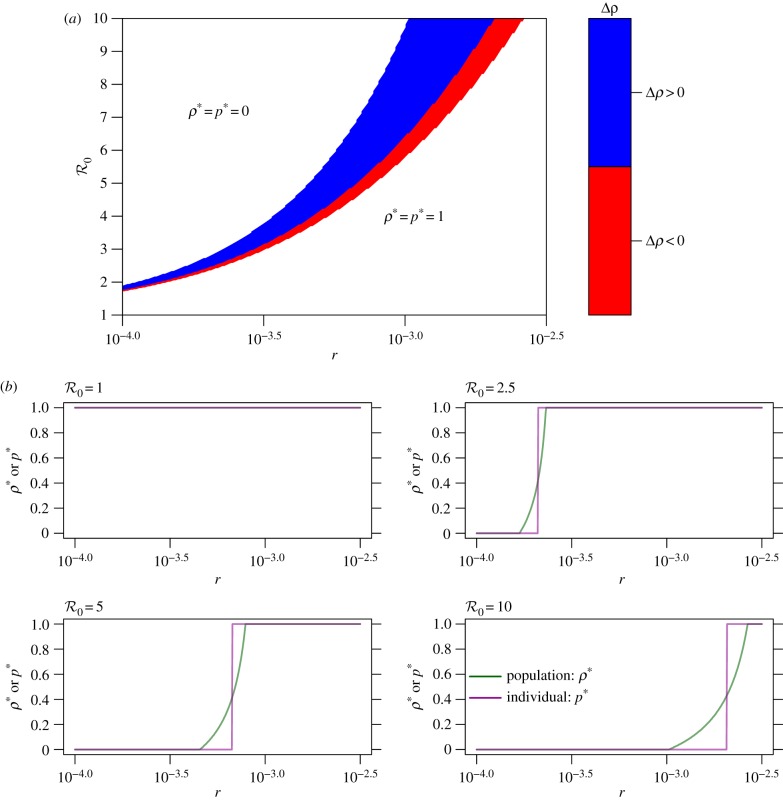
Figure 3.
Discrepancy between individual and population optima as a function of the basic reproduction number  and relative risk r, during an epidemic (i.e. α = 1). (a) The relationship among r (equation (2.5)),
 and Δρ (equation (4.1)); and (b) the relationship between r and Δρ for
  , 2.5, 5.0, 10.0. In (a), the colour code quantifies Δρ. The white area represents Δρ = 0 under the two cases that ρ* = p* = 0 or 1. In (b), ρ* is in green and p* is in purple. In (a,b), the range of
  and the values of the other parameters are listed in table 1. (Online version in colour.)

