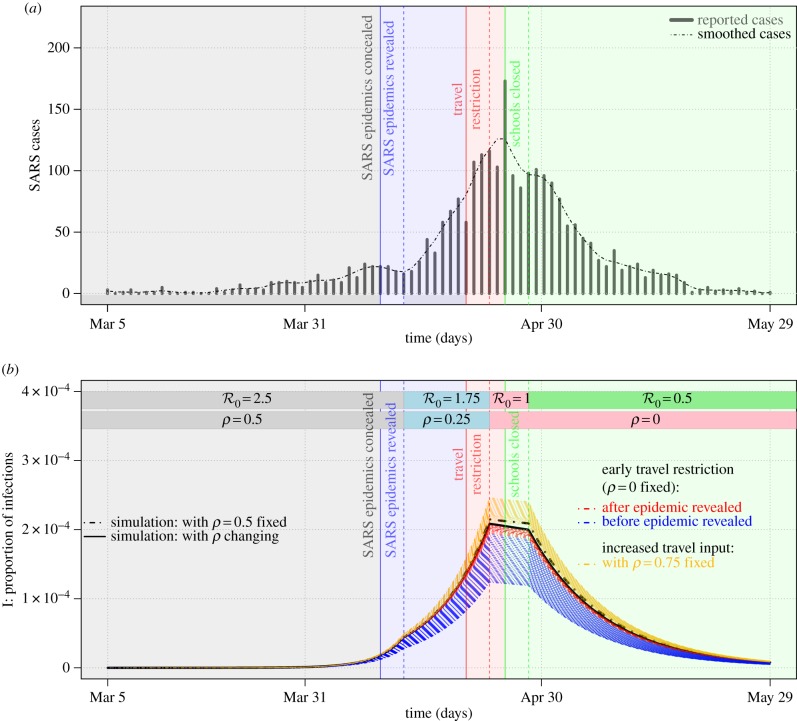
Figure 4.
The 2003 SARS outbreak in Beijing, China. (a) The reported cases during the 2003 SARS outbreak in Beijing, China (adapted from Pang et al. [11]) and (b) the numerical results of the epidemic model (see equations (3.1)). In (a,b) the vertical lines represent the starting points of events, and the vertical dashed lines represent the time points with a lag of 3 days. In (a) the SARS epidemic and government intervention are given on a timeline from 5 March to 29 May 2003. The black dashed line is the time series smoothed by using the LOESS function (R v. 3.4.3 ). In (b) the initial states are set as [S(0), I(0), S1(0), I1(0)] = [(1 − K1), 0, (K1 − 1 × 10⁻⁸), 1 × 10⁻⁸], with  , N1 = 15% and ρ = 0.5 (see grey parts of the bars on the top). The blue and red dashed lines are the simulations under ‘what if’ scenarios in which travel restriction policies were implemented earlier. The black and gold dashed lines are under ‘what if’ scenarios in which travel restriction (or reduction) failed and travel input suddenly increased, respectively. The values of the other parameters are assumed to be the same as those in table 1, and the changes in parameters are marked at the top of the panel. Note that the timelines are the same in (a,b). (Online version in colour.)

