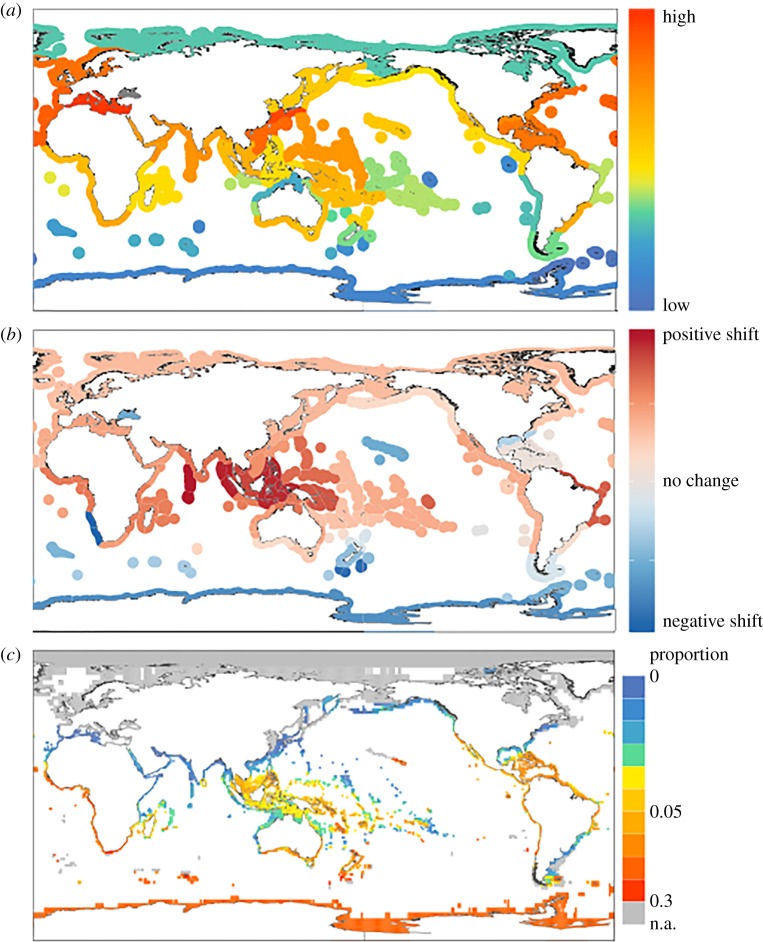
Figure 3.
Comparison of hotspots of human impact, projected velocity of climate change and PERIL scores. (a) Mean human impact scores (Halpern scores, see [9] and SOM) in Spalding et al. [44] provinces. (b) Mean climate velocity (Burrows scores, see [9] and electronic supplementary material) in Spalding provinces and (c) PERIL scores: proportion of taxa in grid-cells scoring higher than the 80th percentile (as in figure 2(a)).

